Markets
Mapped: The Top 10 Billionaire Cities
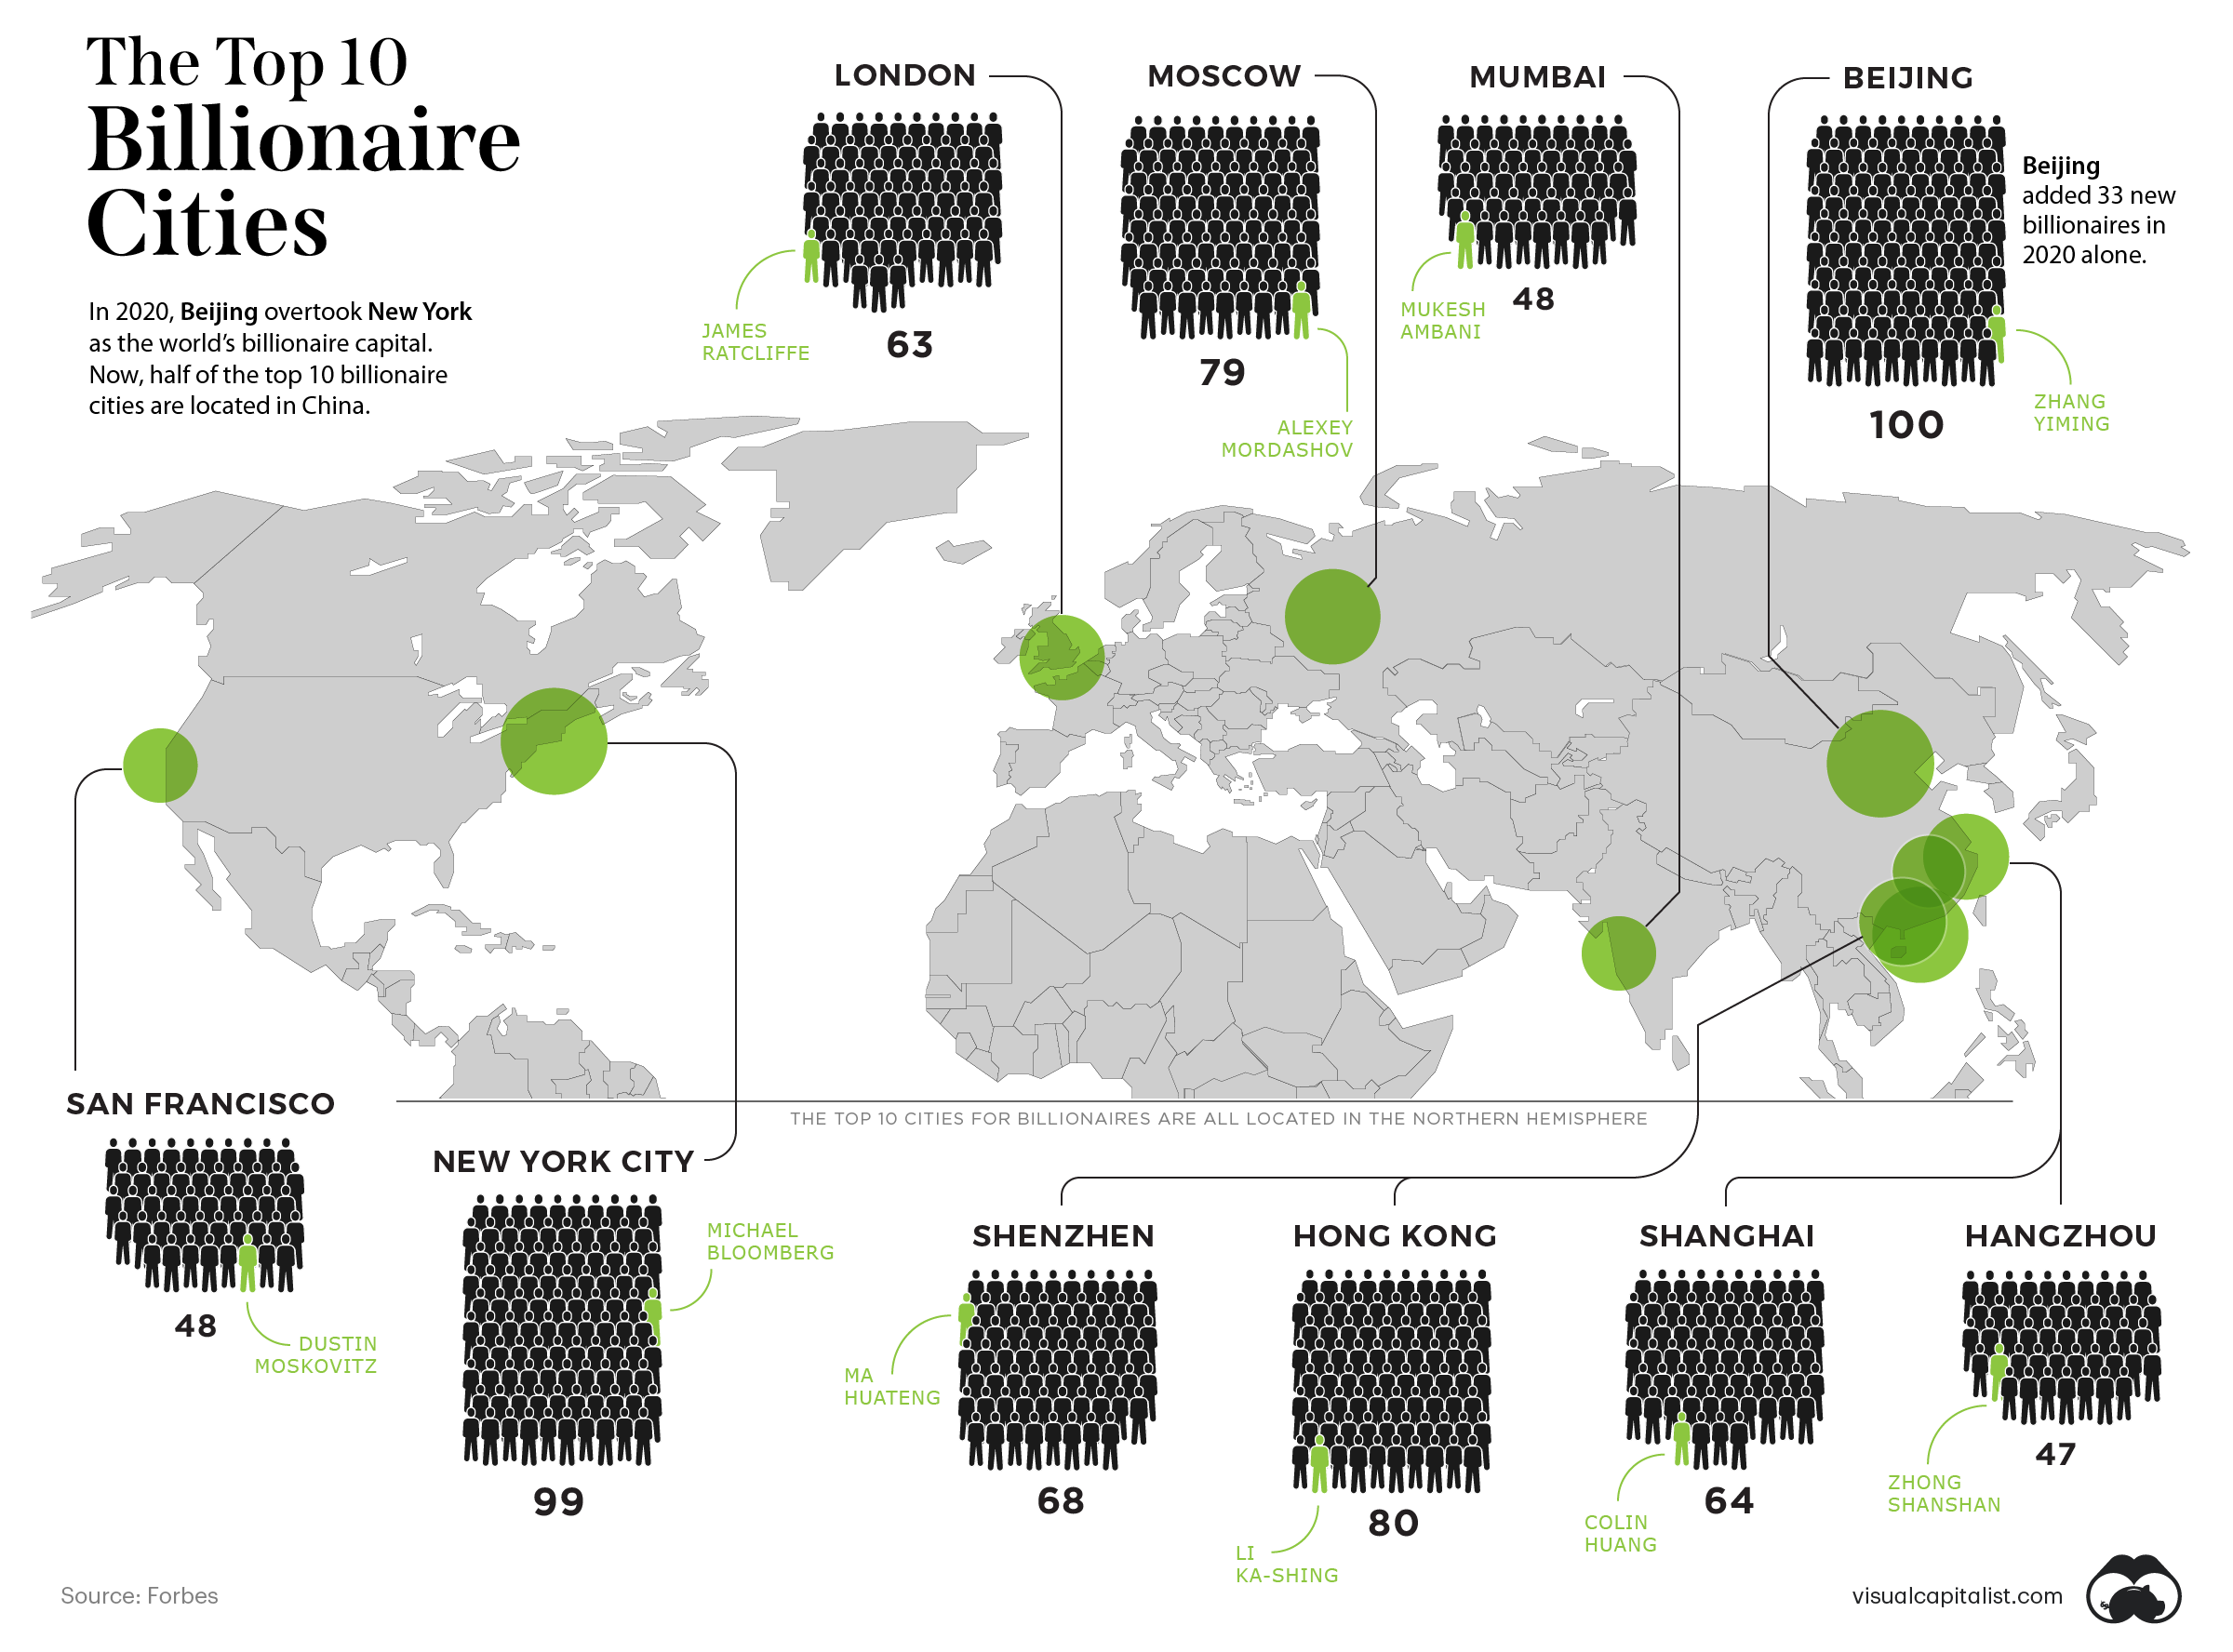


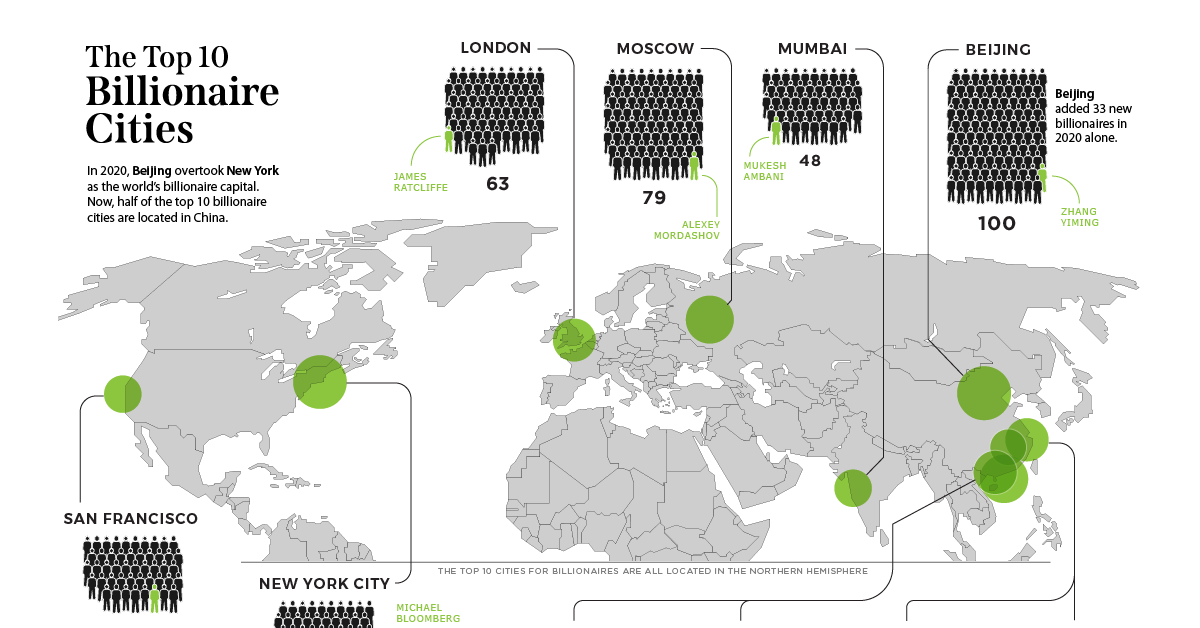
Mapped: The Top 10 Billionaire Cities in 2020
In 2020, the world gained 493 new billionaires—that’s one every 17 hours.
For the last seven years, New York City has been home to more billionaires than any other city in the world. However, last year marked a monumental shift in the status quo.
Beijing has unseated the Big Apple, and is now home to 100 billionaires. That’s one more billionaire than the 99 living in New York City.
Today’s map uses data from Forbes to display the top 10 cities that house the most billionaires.
Where do the Most Billionaires Live?
The richest of the rich are quite concentrated in cities, but some cities seem to best suit the billionaire lifestyle. Here’s a breakdown of the top 10 billionaire capitals and the collective net worth of all the ultra wealthy that live there.
| Rank | City | Region | Number of Billionaires | Net Worth of the City's Billionaires |
|---|---|---|---|---|
| #1 | Beijing | 🇨🇳 Asia | 100 | $484.3B |
| #2 | New York City | 🇺🇸 North America | 99 | $560.5B |
| #3 | Hong Kong | 🇨🇳 Asia | 80 | $448.4B |
| #4 | Moscow | 🇷🇺 Europe | 79 | $420.6B |
| #5 | Shenzhen | 🇨🇳 Asia | 68 | $415.3B |
| #6 | Shanghai | 🇨🇳 Asia | 64 | $259.6B |
| #7 | London | 🇬🇧 Europe | 63 | $316.1B |
| #8 | Mumbai | 🇮🇳 Asia | 48 | $265.0B |
| #9 | San Fransisco | 🇺🇸 North America | 48 | $190.0B |
| #10 | Hangzhou | 🇨🇳 Asia | 47 | $269.2B |
Some cities have some obvious billionaires that come to mind. New York’s richest person and former mayor, Michael Bloomberg, is worth $59 billion. Beijing’s richest billionaire is the founder of TikTok (among other things), Zhang Yiming with a net worth of $35.6 billion.
In terms of the locations themselves, London, New York, and San Francisco are the only Western cities to make the list. Though New York was ousted from the top position last year, altogether the city’s billionaires are still worth more than Beijing’s.
One new city to make the top 10 list of billionaire cities was Hangzhou, the home of Jack Ma. It booted out Singapore from the 10th spot.
East Meets West
More than half of the top 10 cities are located in Asia, providing evidence of the shift eastwards when it comes to seats of wealth. Five of the six Asian cities listed are all in China.
What’s helped lead to this?
The country has seen an e-commerce boom, not in the least thanks to the pandemic. Additionally, the efficient handling of COVID-19 has allowed the economy to get back on track much more quickly than other countries. According to the BBC, 50% of China’s new billionaires have made their wealth either through tech or manufacturing.
Four of the Chinese cities on the list also had the biggest billionaire growth in 2020. Each of them gained more than 10 net new billionaires:
- 🇨🇳 Hangzhou: 21
- 🇨🇳 Shanghai: 18
- 🇨🇳 Shenzhen: 24
- 🇨🇳 Beijing: 33
The only other city to gain more than 10 new billionaires in 2020 was San Francisco with 11.
Now sitting at 698 billionaires, China is coming up on the 724 held by the United States. Beijing overtaking NYC could be the beginning of a larger tipping point.
Shifting Tides
Asia-Pacific’s collective 1,149 billionaires are worth $4.7 trillion, while U.S. billionaires are worth $4.4 trillion in total wealth.
Overall, it looks like the wealth tides may be turning as China continues to progress economically and more billionaires become based in the East over the West.


Economy
Economic Growth Forecasts for G7 and BRICS Countries in 2024
The IMF has released its economic growth forecasts for 2024. How do the G7 and BRICS countries compare?


G7 & BRICS Real GDP Growth Forecasts for 2024
The International Monetary Fund’s (IMF) has released its real gross domestic product (GDP) growth forecasts for 2024, and while global growth is projected to stay steady at 3.2%, various major nations are seeing declining forecasts.
This chart visualizes the 2024 real GDP growth forecasts using data from the IMF’s 2024 World Economic Outlook for G7 and BRICS member nations along with Saudi Arabia, which is still considering an invitation to join the bloc.
Get the Key Insights of the IMF’s World Economic Outlook
Want a visual breakdown of the insights from the IMF’s 2024 World Economic Outlook report?
This visual is part of a special dispatch of the key takeaways exclusively for VC+ members.
Get the full dispatch of charts by signing up to VC+.
Mixed Economic Growth Prospects for Major Nations in 2024
Economic growth projections by the IMF for major nations are mixed, with the majority of G7 and BRICS countries forecasted to have slower growth in 2024 compared to 2023.
Only three BRICS-invited or member countries, Saudi Arabia, the UAE, and South Africa, have higher projected real GDP growth rates in 2024 than last year.
| Group | Country | Real GDP Growth (2023) | Real GDP Growth (2024P) |
|---|---|---|---|
| G7 | 🇺🇸 U.S. | 2.5% | 2.7% |
| G7 | 🇨🇦 Canada | 1.1% | 1.2% |
| G7 | 🇯🇵 Japan | 1.9% | 0.9% |
| G7 | 🇫🇷 France | 0.9% | 0.7% |
| G7 | 🇮🇹 Italy | 0.9% | 0.7% |
| G7 | 🇬🇧 UK | 0.1% | 0.5% |
| G7 | 🇩🇪 Germany | -0.3% | 0.2% |
| BRICS | 🇮🇳 India | 7.8% | 6.8% |
| BRICS | 🇨🇳 China | 5.2% | 4.6% |
| BRICS | 🇦🇪 UAE | 3.4% | 3.5% |
| BRICS | 🇮🇷 Iran | 4.7% | 3.3% |
| BRICS | 🇷🇺 Russia | 3.6% | 3.2% |
| BRICS | 🇪🇬 Egypt | 3.8% | 3.0% |
| BRICS-invited | 🇸🇦 Saudi Arabia | -0.8% | 2.6% |
| BRICS | 🇧🇷 Brazil | 2.9% | 2.2% |
| BRICS | 🇿🇦 South Africa | 0.6% | 0.9% |
| BRICS | 🇪🇹 Ethiopia | 7.2% | 6.2% |
| 🌍 World | 3.2% | 3.2% |
China and India are forecasted to maintain relatively high growth rates in 2024 at 4.6% and 6.8% respectively, but compared to the previous year, China is growing 0.6 percentage points slower while India is an entire percentage point slower.
On the other hand, four G7 nations are set to grow faster than last year, which includes Germany making its comeback from its negative real GDP growth of -0.3% in 2023.
Faster Growth for BRICS than G7 Nations
Despite mostly lower growth forecasts in 2024 compared to 2023, BRICS nations still have a significantly higher average growth forecast at 3.6% compared to the G7 average of 1%.
While the G7 countries’ combined GDP is around $15 trillion greater than the BRICS nations, with continued higher growth rates and the potential to add more members, BRICS looks likely to overtake the G7 in economic size within two decades.
BRICS Expansion Stutters Before October 2024 Summit
BRICS’ recent expansion has stuttered slightly, as Argentina’s newly-elected president Javier Milei declined its invitation and Saudi Arabia clarified that the country is still considering its invitation and has not joined BRICS yet.
Even with these initial growing pains, South Africa’s Foreign Minister Naledi Pandor told reporters in February that 34 different countries have submitted applications to join the growing BRICS bloc.
Any changes to the group are likely to be announced leading up to or at the 2024 BRICS summit which takes place October 22-24 in Kazan, Russia.
Get the Full Analysis of the IMF’s Outlook on VC+
This visual is part of an exclusive special dispatch for VC+ members which breaks down the key takeaways from the IMF’s 2024 World Economic Outlook.
For the full set of charts and analysis, sign up for VC+.

-

 Markets1 week ago
U.S. Debt Interest Payments Reach $1 Trillion
-

 Markets2 weeks ago
Ranked: The Most Valuable Housing Markets in America
-

 Money2 weeks ago
Which States Have the Highest Minimum Wage in America?
-

 AI2 weeks ago
Ranked: Semiconductor Companies by Industry Revenue Share
-

 Markets2 weeks ago
Ranked: The World’s Top Flight Routes, by Revenue
-

 Countries2 weeks ago
Population Projections: The World’s 6 Largest Countries in 2075
-

 Markets2 weeks ago
The Top 10 States by Real GDP Growth in 2023
-

 Money2 weeks ago
The Smallest Gender Wage Gaps in OECD Countries