Markets
Mapped: The Top 10 Billionaire Cities
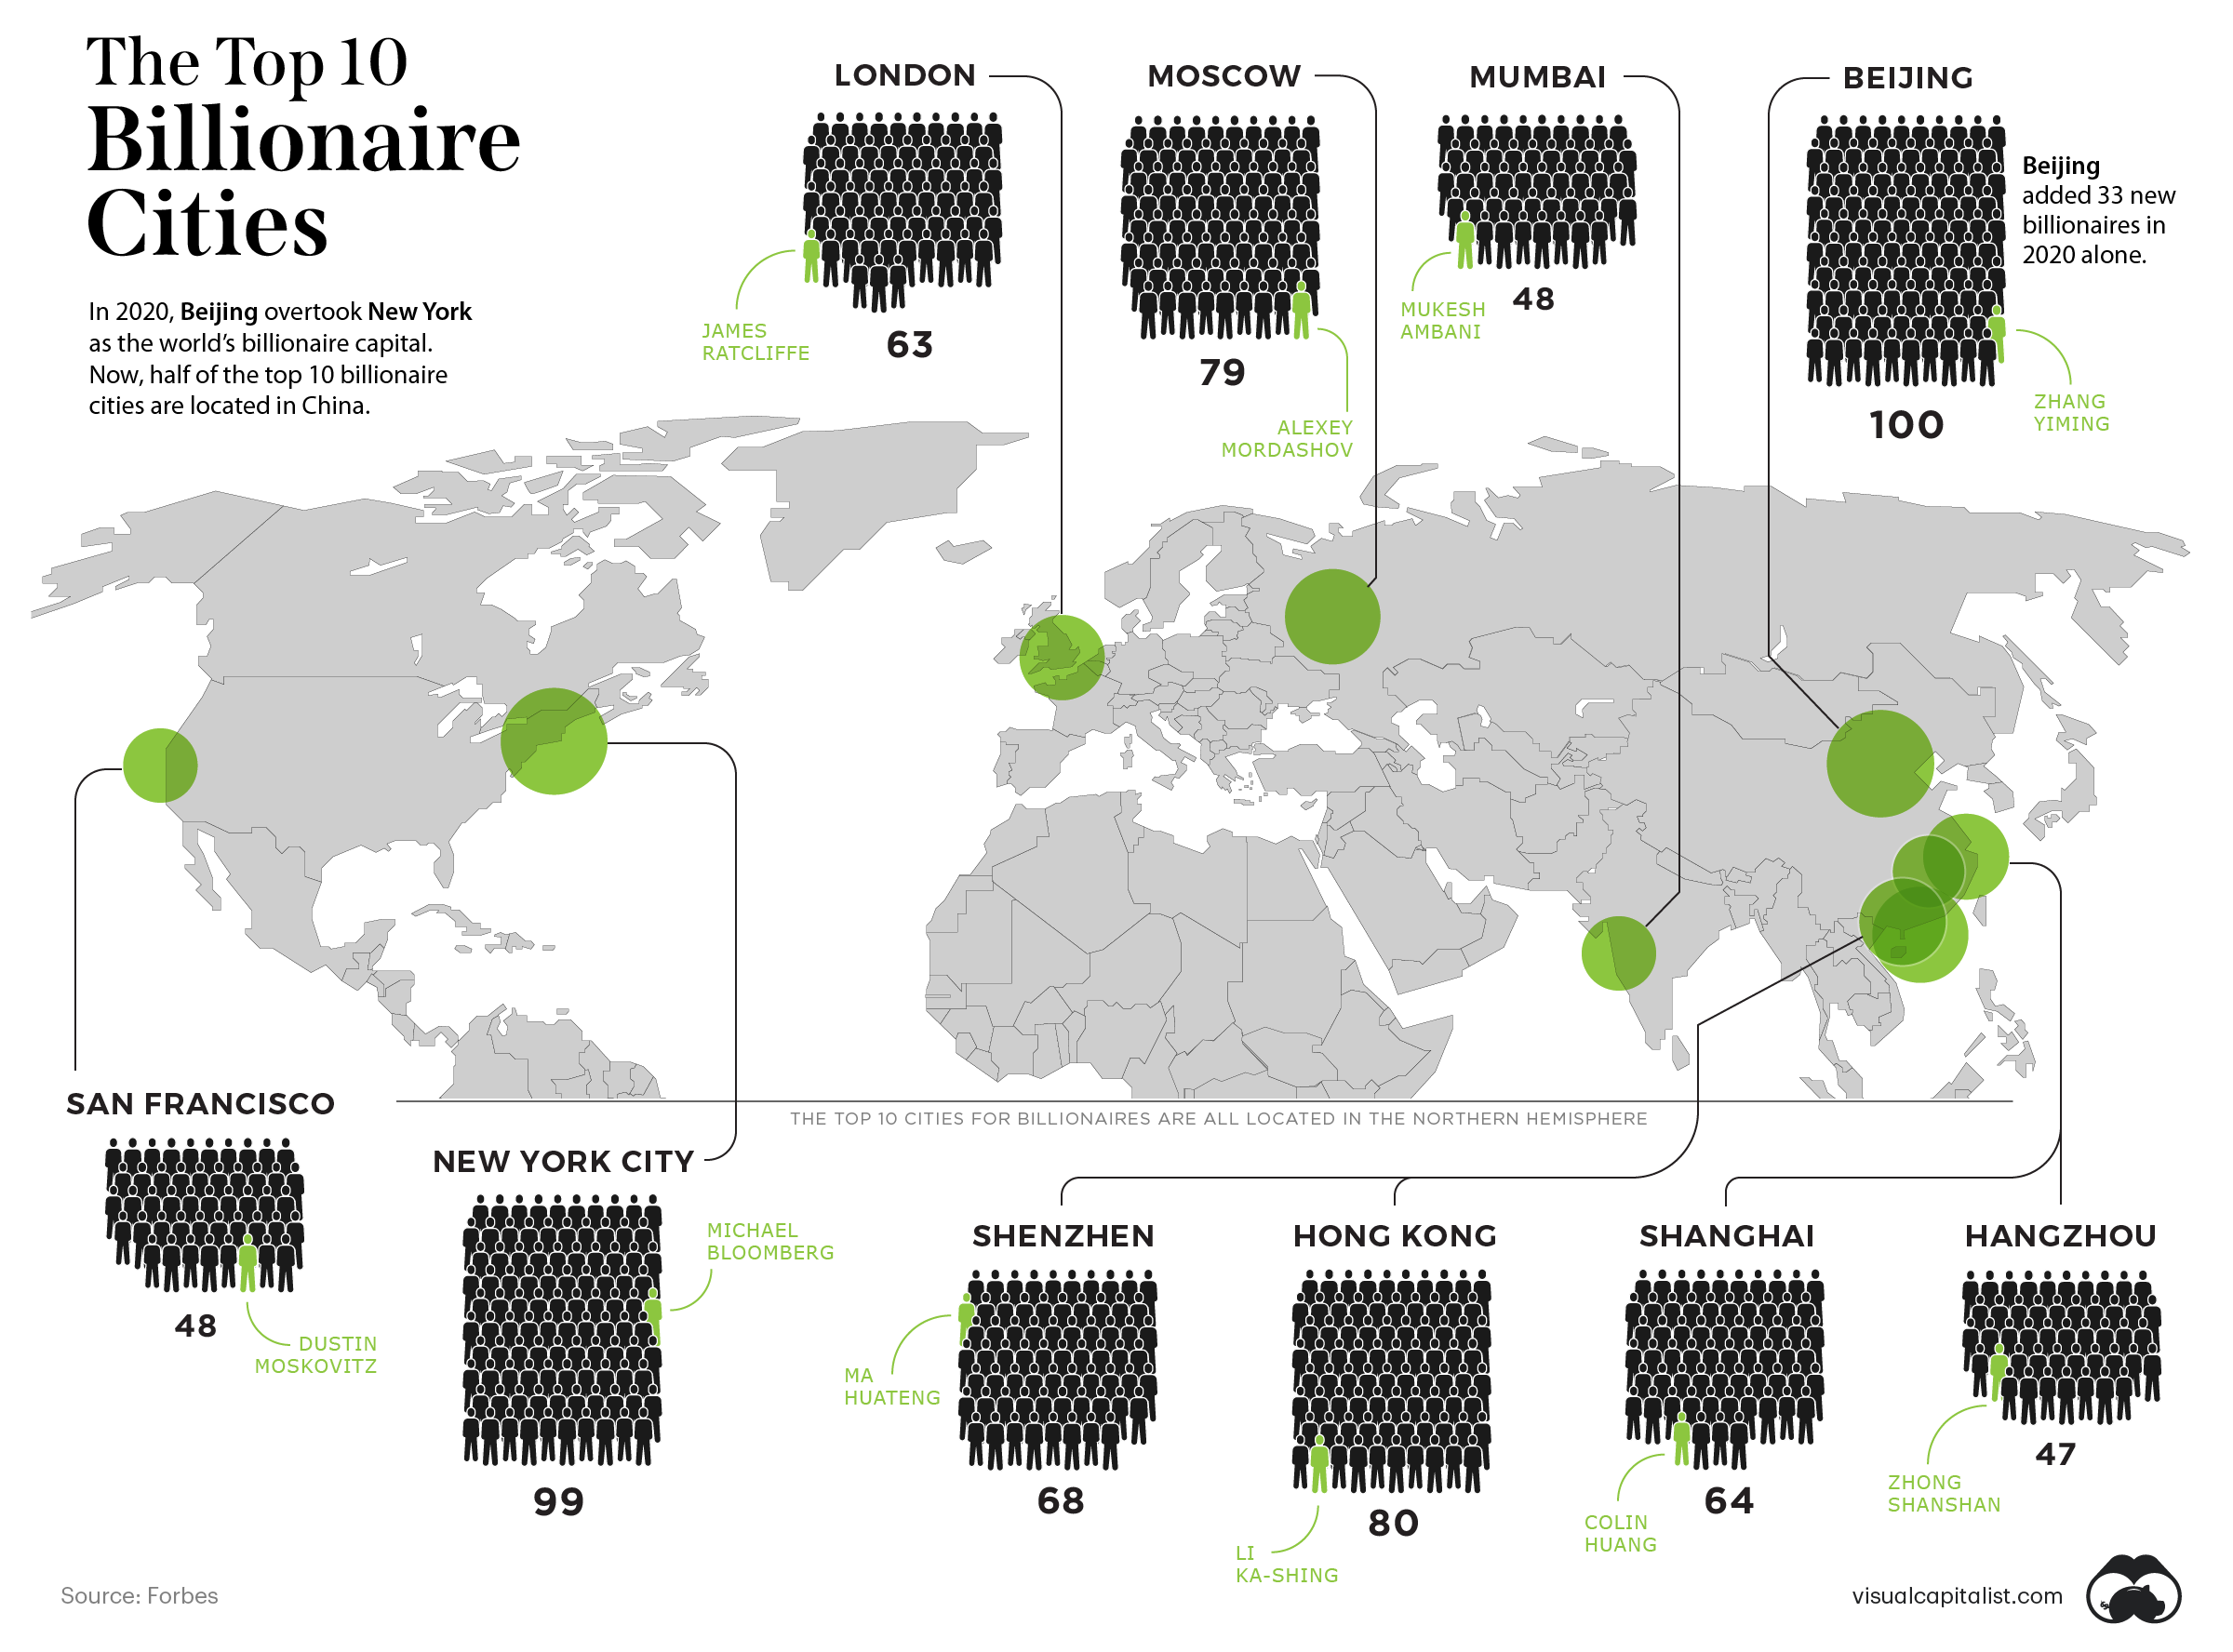


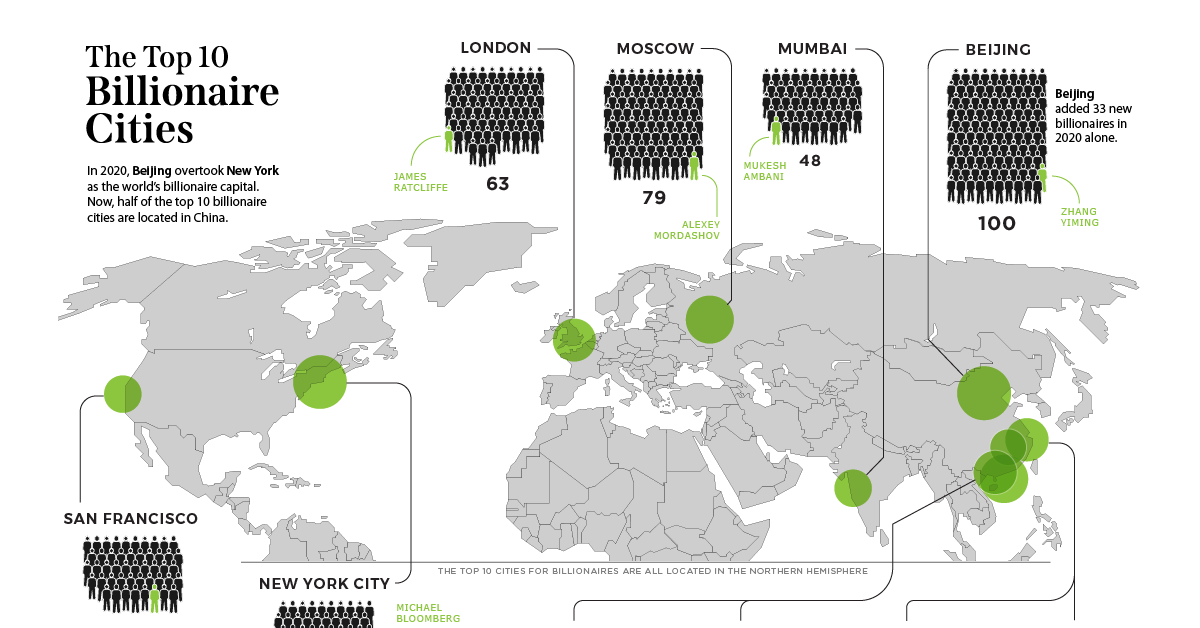
Mapped: The Top 10 Billionaire Cities in 2020
In 2020, the world gained 493 new billionaires—that’s one every 17 hours.
For the last seven years, New York City has been home to more billionaires than any other city in the world. However, last year marked a monumental shift in the status quo.
Beijing has unseated the Big Apple, and is now home to 100 billionaires. That’s one more billionaire than the 99 living in New York City.
Today’s map uses data from Forbes to display the top 10 cities that house the most billionaires.
Where do the Most Billionaires Live?
The richest of the rich are quite concentrated in cities, but some cities seem to best suit the billionaire lifestyle. Here’s a breakdown of the top 10 billionaire capitals and the collective net worth of all the ultra wealthy that live there.
| Rank | City | Region | Number of Billionaires | Net Worth of the City's Billionaires |
|---|---|---|---|---|
| #1 | Beijing | 🇨🇳 Asia | 100 | $484.3B |
| #2 | New York City | 🇺🇸 North America | 99 | $560.5B |
| #3 | Hong Kong | 🇨🇳 Asia | 80 | $448.4B |
| #4 | Moscow | 🇷🇺 Europe | 79 | $420.6B |
| #5 | Shenzhen | 🇨🇳 Asia | 68 | $415.3B |
| #6 | Shanghai | 🇨🇳 Asia | 64 | $259.6B |
| #7 | London | 🇬🇧 Europe | 63 | $316.1B |
| #8 | Mumbai | 🇮🇳 Asia | 48 | $265.0B |
| #9 | San Fransisco | 🇺🇸 North America | 48 | $190.0B |
| #10 | Hangzhou | 🇨🇳 Asia | 47 | $269.2B |
Some cities have some obvious billionaires that come to mind. New York’s richest person and former mayor, Michael Bloomberg, is worth $59 billion. Beijing’s richest billionaire is the founder of TikTok (among other things), Zhang Yiming with a net worth of $35.6 billion.
In terms of the locations themselves, London, New York, and San Francisco are the only Western cities to make the list. Though New York was ousted from the top position last year, altogether the city’s billionaires are still worth more than Beijing’s.
One new city to make the top 10 list of billionaire cities was Hangzhou, the home of Jack Ma. It booted out Singapore from the 10th spot.
East Meets West
More than half of the top 10 cities are located in Asia, providing evidence of the shift eastwards when it comes to seats of wealth. Five of the six Asian cities listed are all in China.
What’s helped lead to this?
The country has seen an e-commerce boom, not in the least thanks to the pandemic. Additionally, the efficient handling of COVID-19 has allowed the economy to get back on track much more quickly than other countries. According to the BBC, 50% of China’s new billionaires have made their wealth either through tech or manufacturing.
Four of the Chinese cities on the list also had the biggest billionaire growth in 2020. Each of them gained more than 10 net new billionaires:
- 🇨🇳 Hangzhou: 21
- 🇨🇳 Shanghai: 18
- 🇨🇳 Shenzhen: 24
- 🇨🇳 Beijing: 33
The only other city to gain more than 10 new billionaires in 2020 was San Francisco with 11.
Now sitting at 698 billionaires, China is coming up on the 724 held by the United States. Beijing overtaking NYC could be the beginning of a larger tipping point.
Shifting Tides
Asia-Pacific’s collective 1,149 billionaires are worth $4.7 trillion, while U.S. billionaires are worth $4.4 trillion in total wealth.
Overall, it looks like the wealth tides may be turning as China continues to progress economically and more billionaires become based in the East over the West.


Markets
The European Stock Market: Attractive Valuations Offer Opportunities
On average, the European stock market has valuations that are nearly 50% lower than U.S. valuations. But how can you access the market?


European Stock Market: Attractive Valuations Offer Opportunities
Europe is known for some established brands, from L’Oréal to Louis Vuitton. However, the European stock market offers additional opportunities that may be lesser known.
The above infographic, sponsored by STOXX, outlines why investors may want to consider European stocks.
Attractive Valuations
Compared to most North American and Asian markets, European stocks offer lower or comparable valuations.
| Index | Price-to-Earnings Ratio | Price-to-Book Ratio |
|---|---|---|
| EURO STOXX 50 | 14.9 | 2.2 |
| STOXX Europe 600 | 14.4 | 2 |
| U.S. | 25.9 | 4.7 |
| Canada | 16.1 | 1.8 |
| Japan | 15.4 | 1.6 |
| Asia Pacific ex. China | 17.1 | 1.8 |
Data as of February 29, 2024. See graphic for full index names. Ratios based on trailing 12 month financials. The price to earnings ratio excludes companies with negative earnings.
On average, European valuations are nearly 50% lower than U.S. valuations, potentially offering an affordable entry point for investors.
Research also shows that lower price ratios have historically led to higher long-term returns.
Market Movements Not Closely Connected
Over the last decade, the European stock market had low-to-moderate correlation with North American and Asian equities.
The below chart shows correlations from February 2014 to February 2024. A value closer to zero indicates low correlation, while a value of one would indicate that two regions are moving in perfect unison.
| EURO STOXX 50 | STOXX EUROPE 600 | U.S. | Canada | Japan | Asia Pacific ex. China |
|
|---|---|---|---|---|---|---|
| EURO STOXX 50 | 1.00 | 0.97 | 0.55 | 0.67 | 0.24 | 0.43 |
| STOXX EUROPE 600 | 1.00 | 0.56 | 0.71 | 0.28 | 0.48 | |
| U.S. | 1.00 | 0.73 | 0.12 | 0.25 | ||
| Canada | 1.00 | 0.22 | 0.40 | |||
| Japan | 1.00 | 0.88 | ||||
| Asia Pacific ex. China | 1.00 |
Data is based on daily USD returns.
European equities had relatively independent market movements from North American and Asian markets. One contributing factor could be the differing sector weights in each market. For instance, technology makes up a quarter of the U.S. market, but health care and industrials dominate the broader European market.
Ultimately, European equities can enhance portfolio diversification and have the potential to mitigate risk for investors.
Tracking the Market
For investors interested in European equities, STOXX offers a variety of flagship indices:
| Index | Description | Market Cap |
|---|---|---|
| STOXX Europe 600 | Pan-regional, broad market | €10.5T |
| STOXX Developed Europe | Pan-regional, broad-market | €9.9T |
| STOXX Europe 600 ESG-X | Pan-regional, broad market, sustainability focus | €9.7T |
| STOXX Europe 50 | Pan-regional, blue-chip | €5.1T |
| EURO STOXX 50 | Eurozone, blue-chip | €3.5T |
Data is as of February 29, 2024. Market cap is free float, which represents the shares that are readily available for public trading on stock exchanges.
The EURO STOXX 50 tracks the Eurozone’s biggest and most traded companies. It also underlies one of the world’s largest ranges of ETFs and mutual funds. As of November 2023, there were €27.3 billion in ETFs and €23.5B in mutual fund assets under management tracking the index.
“For the past 25 years, the EURO STOXX 50 has served as an accurate, reliable and tradable representation of the Eurozone equity market.”
— Axel Lomholt, General Manager at STOXX
Partnering with STOXX to Track the European Stock Market
Are you interested in European equities? STOXX can be a valuable partner:
- Comprehensive, liquid and investable ecosystem
- European heritage, global reach
- Highly sophisticated customization capabilities
- Open architecture approach to using data
- Close partnerships with clients
- Part of ISS STOXX and Deutsche Börse Group
With a full suite of indices, STOXX can help you benchmark against the European stock market.
Learn how STOXX’s European indices offer liquid and effective market access.

-

 Economy2 days ago
Economic Growth Forecasts for G7 and BRICS Countries in 2024
The IMF has released its economic growth forecasts for 2024. How do the G7 and BRICS countries compare?
-

 Markets1 week ago
U.S. Debt Interest Payments Reach $1 Trillion
U.S. debt interest payments have surged past the $1 trillion dollar mark, amid high interest rates and an ever-expanding debt burden.
-

 United States2 weeks ago
Ranked: The Largest U.S. Corporations by Number of Employees
We visualized the top U.S. companies by employees, revealing the massive scale of retailers like Walmart, Target, and Home Depot.
-

 Markets2 weeks ago
The Top 10 States by Real GDP Growth in 2023
This graphic shows the states with the highest real GDP growth rate in 2023, largely propelled by the oil and gas boom.
-

 Markets2 weeks ago
Ranked: The World’s Top Flight Routes, by Revenue
In this graphic, we show the highest earning flight routes globally as air travel continued to rebound in 2023.
-

 Markets3 weeks ago
Ranked: The Most Valuable Housing Markets in America
The U.S. residential real estate market is worth a staggering $47.5 trillion. Here are the most valuable housing markets in the country.


-

 Debt1 week ago
How Debt-to-GDP Ratios Have Changed Since 2000
-
Markets2 weeks ago
Ranked: The World’s Top Flight Routes, by Revenue
-

 Countries2 weeks ago
Population Projections: The World’s 6 Largest Countries in 2075
-
Markets2 weeks ago
The Top 10 States by Real GDP Growth in 2023
-

 Demographics2 weeks ago
The Smallest Gender Wage Gaps in OECD Countries
-

 United States2 weeks ago
Where U.S. Inflation Hit the Hardest in March 2024
-

 Green2 weeks ago
Top Countries By Forest Growth Since 2001
-
United States2 weeks ago
Ranked: The Largest U.S. Corporations by Number of Employees