Markets
Mapped: The Top 10 Billionaire Cities
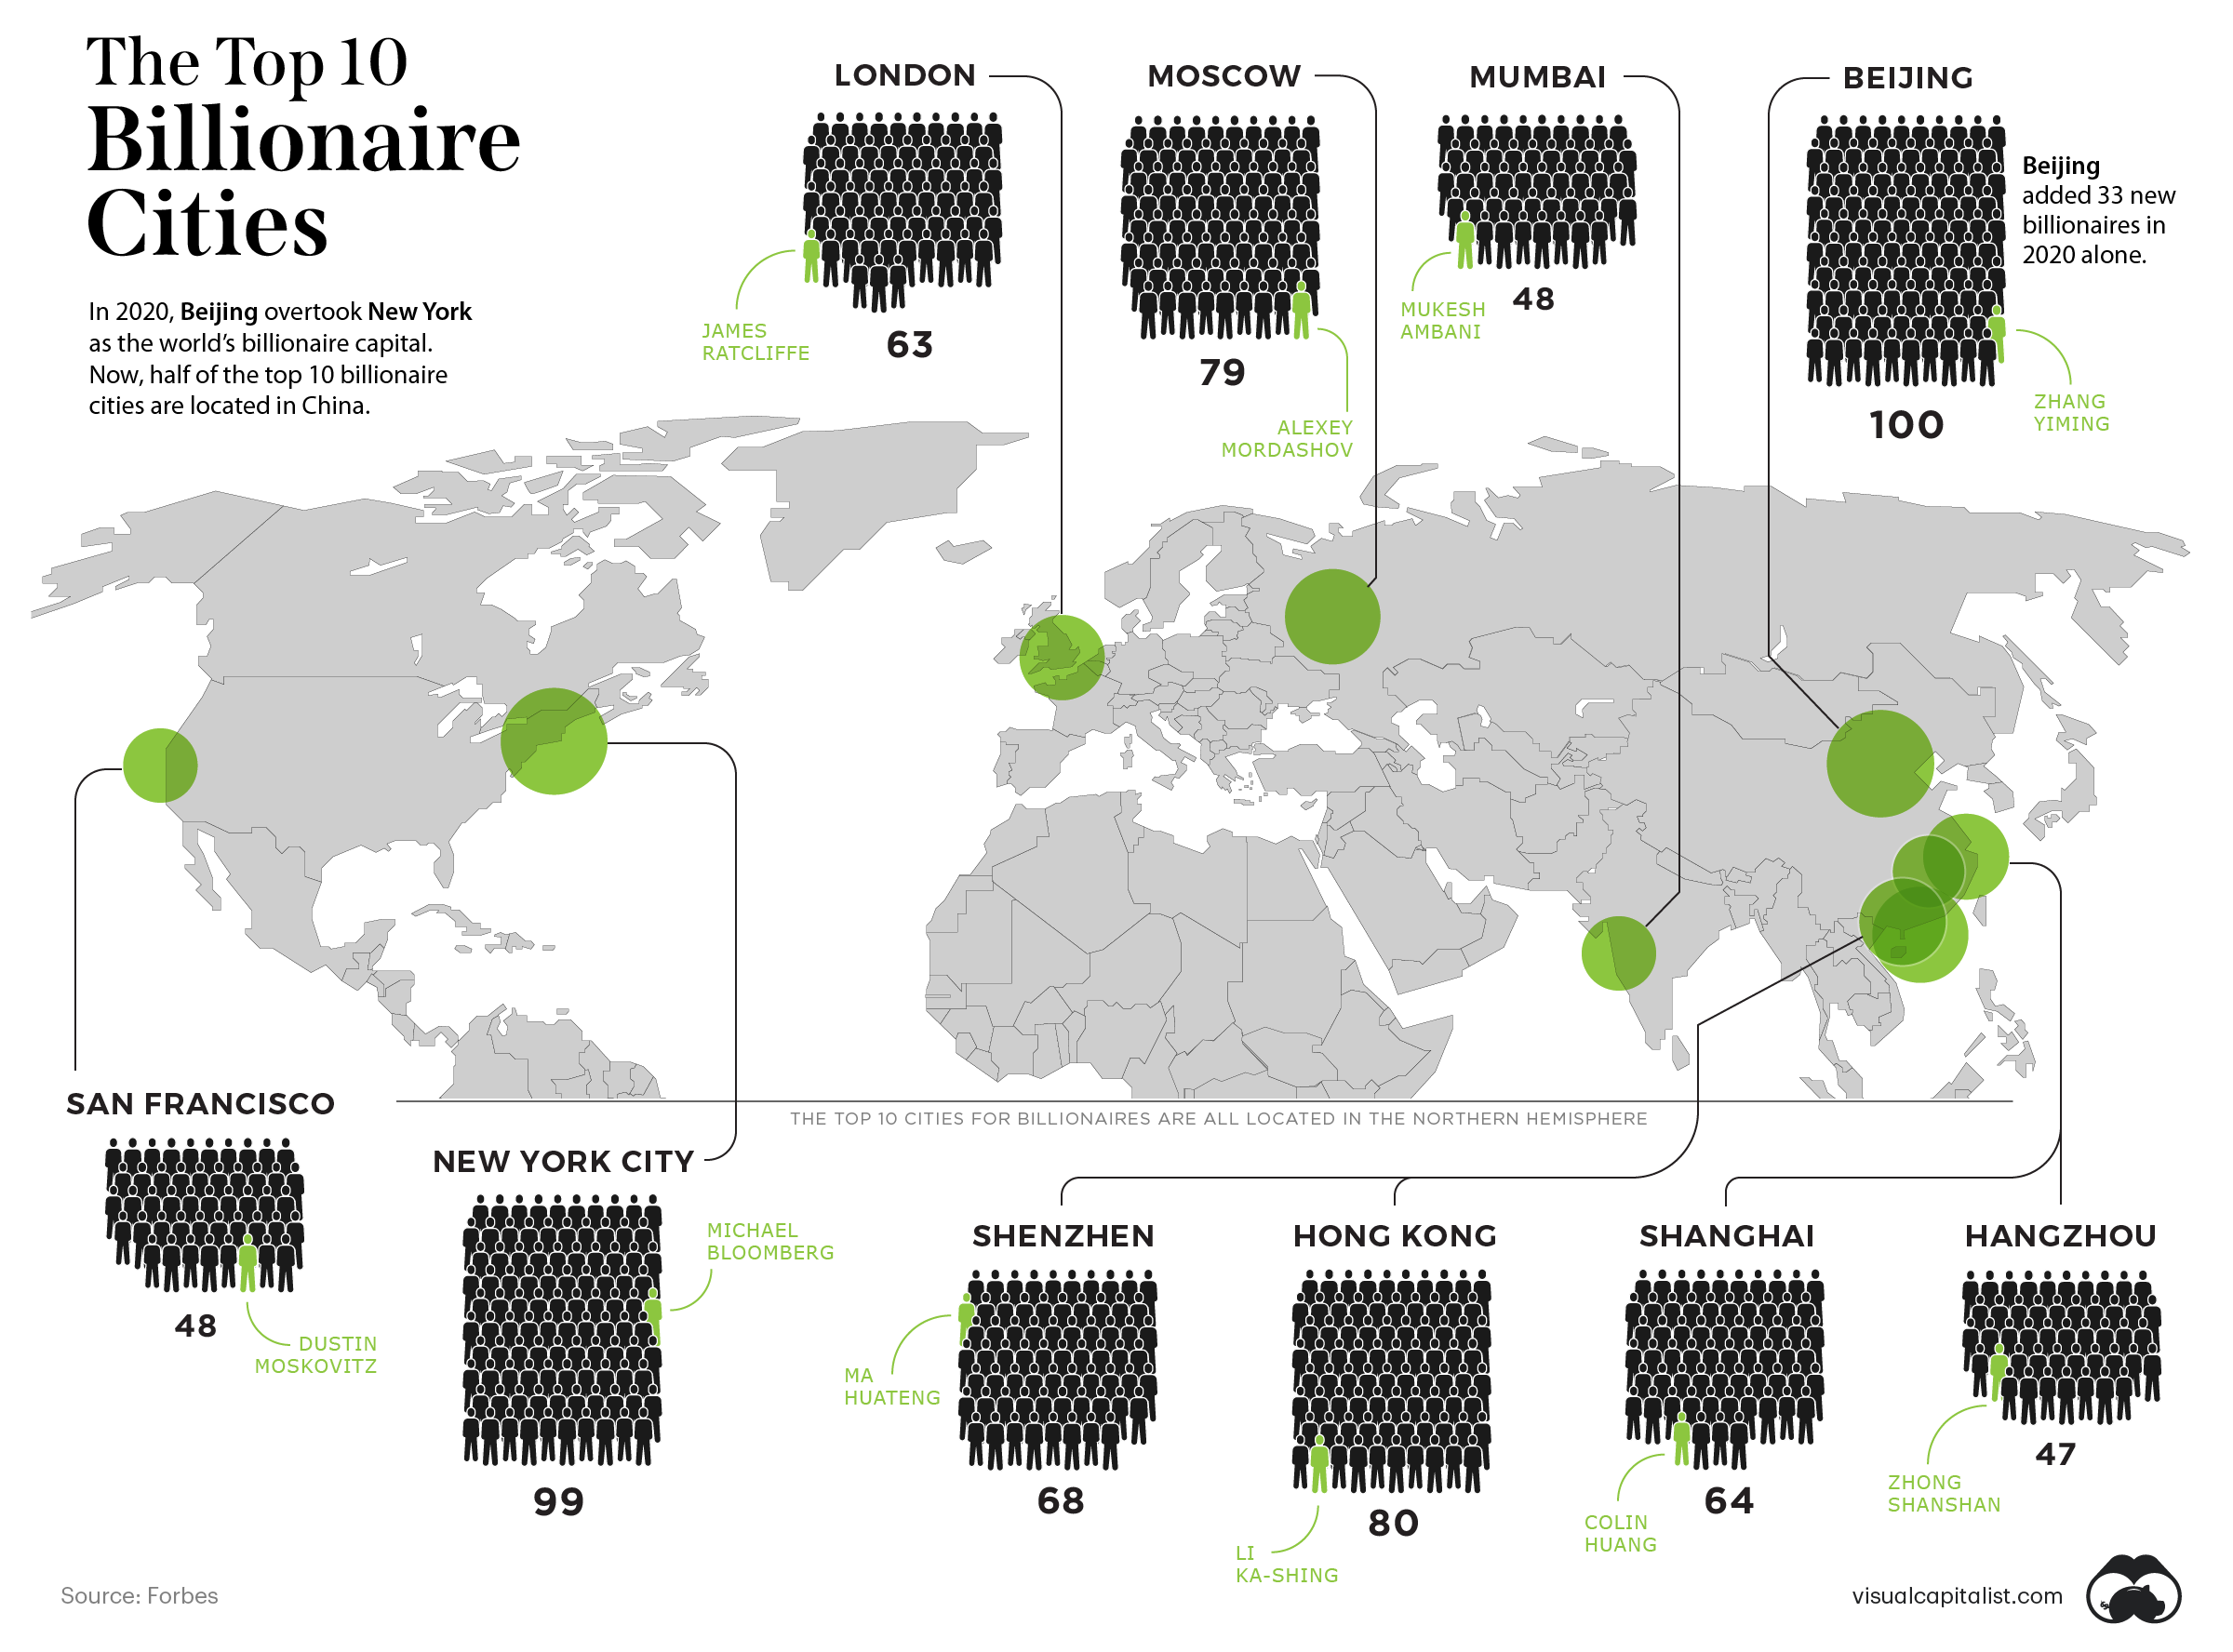


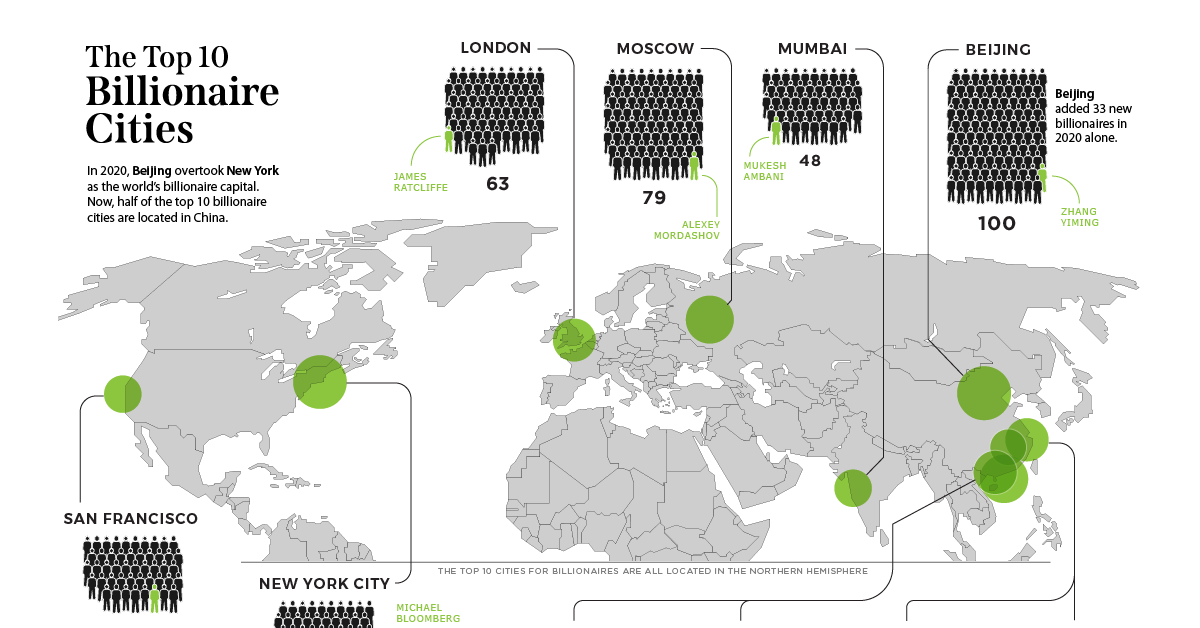
Mapped: The Top 10 Billionaire Cities in 2020
In 2020, the world gained 493 new billionaires—that’s one every 17 hours.
For the last seven years, New York City has been home to more billionaires than any other city in the world. However, last year marked a monumental shift in the status quo.
Beijing has unseated the Big Apple, and is now home to 100 billionaires. That’s one more billionaire than the 99 living in New York City.
Today’s map uses data from Forbes to display the top 10 cities that house the most billionaires.
Where do the Most Billionaires Live?
The richest of the rich are quite concentrated in cities, but some cities seem to best suit the billionaire lifestyle. Here’s a breakdown of the top 10 billionaire capitals and the collective net worth of all the ultra wealthy that live there.
| Rank | City | Region | Number of Billionaires | Net Worth of the City's Billionaires |
|---|---|---|---|---|
| #1 | Beijing | 🇨🇳 Asia | 100 | $484.3B |
| #2 | New York City | 🇺🇸 North America | 99 | $560.5B |
| #3 | Hong Kong | 🇨🇳 Asia | 80 | $448.4B |
| #4 | Moscow | 🇷🇺 Europe | 79 | $420.6B |
| #5 | Shenzhen | 🇨🇳 Asia | 68 | $415.3B |
| #6 | Shanghai | 🇨🇳 Asia | 64 | $259.6B |
| #7 | London | 🇬🇧 Europe | 63 | $316.1B |
| #8 | Mumbai | 🇮🇳 Asia | 48 | $265.0B |
| #9 | San Fransisco | 🇺🇸 North America | 48 | $190.0B |
| #10 | Hangzhou | 🇨🇳 Asia | 47 | $269.2B |
Some cities have some obvious billionaires that come to mind. New York’s richest person and former mayor, Michael Bloomberg, is worth $59 billion. Beijing’s richest billionaire is the founder of TikTok (among other things), Zhang Yiming with a net worth of $35.6 billion.
In terms of the locations themselves, London, New York, and San Francisco are the only Western cities to make the list. Though New York was ousted from the top position last year, altogether the city’s billionaires are still worth more than Beijing’s.
One new city to make the top 10 list of billionaire cities was Hangzhou, the home of Jack Ma. It booted out Singapore from the 10th spot.
East Meets West
More than half of the top 10 cities are located in Asia, providing evidence of the shift eastwards when it comes to seats of wealth. Five of the six Asian cities listed are all in China.
What’s helped lead to this?
The country has seen an e-commerce boom, not in the least thanks to the pandemic. Additionally, the efficient handling of COVID-19 has allowed the economy to get back on track much more quickly than other countries. According to the BBC, 50% of China’s new billionaires have made their wealth either through tech or manufacturing.
Four of the Chinese cities on the list also had the biggest billionaire growth in 2020. Each of them gained more than 10 net new billionaires:
- 🇨🇳 Hangzhou: 21
- 🇨🇳 Shanghai: 18
- 🇨🇳 Shenzhen: 24
- 🇨🇳 Beijing: 33
The only other city to gain more than 10 new billionaires in 2020 was San Francisco with 11.
Now sitting at 698 billionaires, China is coming up on the 724 held by the United States. Beijing overtaking NYC could be the beginning of a larger tipping point.
Shifting Tides
Asia-Pacific’s collective 1,149 billionaires are worth $4.7 trillion, while U.S. billionaires are worth $4.4 trillion in total wealth.
Overall, it looks like the wealth tides may be turning as China continues to progress economically and more billionaires become based in the East over the West.


Markets
Visualizing Global Inflation Forecasts (2024-2026)
Here are IMF forecasts for global inflation rates up to 2026, highlighting a slow descent of price pressures amid resilient global growth.


Visualizing Global Inflation Forecasts (2024-2026)
Global inflation rates are gradually descending, but progress has been slow.
Today, the big question is if inflation will decline far enough to trigger easing monetary policy. So far, the Federal Reserve has held rates for nine months amid stronger than expected core inflation, which excludes volatile energy and food prices.
Yet looking further ahead, inflation forecasts from the International Monetary Fund (IMF) suggest that inflation will decline as price pressures ease, but the path of disinflation is not without its unknown risks.
This graphic shows global inflation forecasts, based on data from the April 2024 IMF World Economic Outlook.
Get the Key Insights of the IMF’s World Economic Outlook
Want a visual breakdown of the insights from the IMF’s 2024 World Economic Outlook report?
This visual is part of a special dispatch of the key takeaways exclusively for VC+ members.
Get the full dispatch of charts by signing up to VC+.
The IMF’s Inflation Outlook
Below, we show the IMF’s latest projections for global inflation rates through to 2026:
| Year | Global Inflation Rate (%) | Advanced Economies Inflation Rate (%) | Emerging Market and Developing Economies Inflation Rate (%) |
|---|---|---|---|
| 2019 | 3.5 | 1.4 | 5.1 |
| 2020 | 3.2 | 0.7 | 5.2 |
| 2021 | 4.7 | 3.1 | 5.9 |
| 2022 | 8.7 | 7.3 | 9.8 |
| 2023 | 6.8 | 4.6 | 8.3 |
| 2024 | 5.9 | 2.6 | 8.3 |
| 2025 | 4.5 | 2.0 | 6.2 |
| 2026 | 3.7 | 2.0 | 4.9 |
After hitting a peak of 8.7% in 2022, global inflation is projected to fall to 5.9% in 2024, reflecting promising inflation trends amid resilient global growth.
While inflation has largely declined due to falling energy and goods prices, persistently high services inflation poses challenges to mitigating price pressures. In addition, the IMF highlights the potential risk of an escalating conflict in the Middle East, which could lead to energy price shocks and higher shipping costs.
These developments could negatively affect inflation scenarios and prompt central banks to adopt tighter monetary policies. Overall, by 2026, global inflation is anticipated to decline to 3.7%—still notably above the 2% target set by several major economies.
Adding to this, we can see divergences in the path of inflation between advanced and emerging economies. While affluent nations are forecast to see inflation edge closer to the 2% target by 2026, emerging economies are projected to have inflation rates reach 4.9%—falling closer to their pre-pandemic averages.
Get the Full Analysis of the IMF’s Outlook on VC+
This visual is part of an exclusive special dispatch for VC+ members which breaks down the key takeaways from the IMF’s 2024 World Economic Outlook.
For the full set of charts and analysis, sign up for VC+.

-

 Culture6 days ago
The World’s Top Media Franchises by All-Time Revenue
-

 Science2 weeks ago
Visualizing the Average Lifespans of Mammals
-

 Brands2 weeks ago
How Tech Logos Have Evolved Over Time
-

 Energy2 weeks ago
Ranked: The Top 10 EV Battery Manufacturers in 2023
-

 Countries2 weeks ago
Countries With the Largest Happiness Gains Since 2010
-

 Economy2 weeks ago
VC+: Get Our Key Takeaways From the IMF’s World Economic Outlook
-

 Demographics2 weeks ago
The Countries That Have Become Sadder Since 2010
-

 Money1 week ago
Charted: Who Has Savings in This Economy?