A Survey of Consumer Perceptions of Plant-Based and Clean Meat in the USA, India, and China
 Christopher Bryant
 Keri Szejda
 Nishant Parekh
 Varun Deshpande
 Brian Tse
- 1Department of Psychology, University of Bath, Bath, United Kingdom
- 2The Good Food Institute, Washington, DC, United States
- 3Center for Long Term Priorities, Hong Kong, China
Recent years have seen increasing interest in research on consumer acceptance of clean meat. Whilst some consumers are enthusiastic about the prospect of reducing the health risks, environmental harms, and animal welfare implications associated with conventional meat production, others have concerns about the product's taste, price, safety, and naturalness. Some evidence suggests that acceptance of clean meat will vary substantially across cultures, though there is currently a lack of quantitative research in Asia and country comparisons on this topic. Both are likely to be important areas given the forecasted increase in meat consumption in developing countries. Participants (n = 3.030) were recruited through the research panel CINT to take an online questionnaire about clean meat and plant-based meat. The participants were representative of China, India, and the U.S. in terms of age and gender, though participants in India and China were disproportionately urban, high income, and well-educated. As well as clean meat, participants were asked about plant-based meat, a conceptually similar product with similar potential to displace demand for conventional meat. They also answered the Meat Attachment Questionnaire and the Food Neophobia Scale. We compared these variables between countries, and used regression models to identify which demographic and attitudinal factors predicted purchase intent toward both products. We found significantly higher acceptance of clean and plant-based meat in India and China compared to the USA. We also found significantly higher food neophobia and significantly lower meat attachment in India compared to China and the USA. We identified several demographic patterns of clean and plant-based meat acceptance as well as which beliefs were important predictors of acceptance within each country. In particular, higher familiarity predicted higher acceptance of plant-based and clean meat across all countries. We found high levels of acceptance of clean meat in the three most populous countries worldwide, and with even higher levels of acceptance in China and India compared to the USA. These results underline the importance of clean meat producers exploring new markets for their products, especially as meat consumption in developing countries continues to rise.
Introduction
Conventional meat produced by rearing animals is associated with a range of important global problems, including greenhouse gas emissions, deforestation, and freshwater consumption (McMichael et al., 2007, p. 63). In recent years, there has been increasing interest in alternative ways of producing meat. Clean meat is produced by culturing animal cells in a suitable medium (Post, 2012), whilst plant-based meat is made directly from plant materials (Good Food Institute, 2018).
In the future, the wide scale production of clean meat without animals will help alleviate many of the ethical, environmental, and public health issues associated with meat production today (Bryant and Barnett, 2018, p. 8). Similarly, plant-based meat is becoming an increasingly viable alternative to conventional meat as quality improves and these products become more mainstream (Wild et al., 2014, p. 48). However, the benefits of these products will only be realized to the extent that they displace demand for conventional meat. With much of the forecast 73% rise in demand for meat by 2050 coming from developing countries (Food and Agriculture Organization, 2011 p. 79), there is a concerning lack of research on consumer acceptance of clean and plant-based meat outside of the West.
In particular, China and India have been identified as prime countries in which to conduct consumer surveys on clean meat (Bryant and Barnett, 2018, p. 16). Indeed, not only do these countries have the highest populations in the world, but rising economies mean that their meat consumption is likely to increase over the coming decades as more consumers can afford meat. Furthermore, substantial cultural differences from the West, where most consumer acceptance research has been conducted, mean that consumer acceptance in China and India may differ in character.
Limited research has explored consumer acceptance of clean meat in China. YouGov (2018) reported that 26% of Chinese consumers said they would eat clean meat, which was amongst the lowest rate of acceptance compared to other countries in Asia. This series of surveys yielded evidence of substantial differences between countries. For example, 34% of Thai consumers said they would eat clean meat and 52% of Vietnamese consumers said they would eat clean meat. India was not part of this survey, and very little is known about consumer perceptions of clean meat in India.
Other research has similarly explored cross-cultural variations in acceptance of clean meat. Surveygoo (2018)reported that, whilst 40% of US consumers said they would buy clean meat, the figure was just 18% for UK consumers. Likewise, (Hoek et al., p. 667) found significantly higher use of plant-based meats in the UK compared to the Netherlands. In a small study of graduate students, Bekker et al. (2017) explored responses to clean meat amongst Chinese, Ethiopian, and Dutch consumers. The authors found that Dutch consumers were more focused on research, development, and future expectations, whereas Chinese consumers were the only ones to discuss their own intentions toward clean meat. However, this study was qualitative in design, and the sample was limited to just 30 graduate students. Therefore, the findings are not generalizable to the total populations of these countries.
Whilst there have been many surveys on this question in the USA and various countries in Europe (Eurobarometer, 2005; YouGov, 2013; Wilks and Phillips, 2017), the results of these are not necessarily comparable. Even within countries, different surveys can show wildly different rates of acceptance, based on variations in question design and terminology (Bryant and Barnett, 2018, p. 15). Surveys that ask the same questions at the same time in different countries are far less common. Therefore, the present study can add significantly to the research by using the same surveys at the same time to directly compare consumer perceptions in potentially important countries.
The present study seeks to investigate the nature of consumer acceptance of clean meat in the U.S., India, and China. We also investigate consumer acceptance of a related technology, plant-based meat as well as two potentially relevant theoretical constructs: food neophobia (Pliner and Hobden, 1992) and meat attachment (Graça et al., 2015).
Materials and Methods
Participants
Participants were recruited online through the research panel, CINT, via the research agency Positly. Participants were members of a range of online CINT partner panels who have signed up to take surveys online. They were compensated with a range of incentives for their time (incentives vary across CINT partner panels). We aimed to recruit representative samples of 1,000 people in each country to achieve an acceptable margin of error within each country and be well-powered to detect differences between countries (Cohen, 1992, p. 158; Kotrlik and Higgins, 2001, pp. 46–49).
We set quotas for age and gender for all three countries to ensure that the samples were representative of the general population with respect to these variables. Since internet access is limited among some groups in India and China, these samples were skewed toward higher income and more urban groups. However, this is likely to be representative of the population who will feasibly have access to clean meat in the near future.
We removed participants who were under 18, who did not consent to take part, who failed either of two attention check questions, or who were duplicates of other respondents. The total sample size was 3,030: 987 in the USA, 1,024 in India, and 1,019 in China.
Procedure
This study received ethical approval from the Psychology Research Ethics Committee at the University of Bath (REF 18–137). All participants used a checkbox on the questionnaire to indicate their informed consent in accordance with the Declaration of Helsinki.
Before beginning the survey, participants were given information about the study and were asked whether they consented to take part. Participants who did not give their consent were subsequently removed from the study.
First, participants answered questions about which animal products they ate at least occasionally. This data was used to classify participants as vegan, vegetarian, pescatarian, or omnivore. They also indicated how many times they ate meat for each of three meals in an average week, which was used to classify participants as vegetarian, light meat eater (1–6 times a week in total), medium meat eater (7–13 times a week in total), or heavy meat eater (14 or more times a week in total).
Next, participants completed the Food Neophobia Scale (Pliner and Hobden, 1992, p. 109) and the Meat Attachment Questionnaire (Graça et al., 2015, p. 117). These were presented in a random order, and before any mention of clean or plant-based meat to avoid priming. After completing each of these measures, participants answered one of two simple multiple choice quality checks. These two questions were designed to be easy for humans to answer, while providing a mechanism for filtering out thoughtless or computer-assisted responses. Participants who answered these questions incorrectly were subsequently removed from the survey.
Next, participants rated their attitudes toward conventional meat on 16 different attributes using 5-point semantic differential scales (see section Materials). They then answered questions about clean meat and plant-based meat, with the order of these blocks of questions randomized to control for order effects. Participants were asked about their familiarity with, attitudes toward, and intentions toward, each type of meat.
They were then asked to consider a hypothetical future where clean, plant-based, and conventional meats are all widely available. They indicated which type of meat they preferred and what proportion of their diet they thought would come from each type of meat.
Participants were then asked for demographic information, including age, gender, education, political orientation, dwelling size, and household income. Finally, participants were invited to provide any final comments on clean and plant-based meat before being debriefed and thanked for their time.
Materials
The survey instrument was distributed in English in the USA and India, and was translated into Mandarin for distribution in China. In India, English is widely spoken, particularly amongst the urban population who are the most likely consumers of clean meat. Translation into Mandarin was done using back-translation, which is considered best practice for cross-country research to ensure that meaning is equivalent in the target language (Johnson, 1998, p. 17).
Given the expanding research on clean meat nomenclature in English, we ran two pre-tests to determine which names would be appealing in Chinese. We worked with stakeholder groups to compile a list of potential names in Chinese, and then had a small sample of Chinese consumers (N = 164) rank them for appeal and descriptiveness. Based on this data, we decided to use the term “纯净肉” (approximately translates to “purity meat”) for clean meat and the term ‘蔬食肉’ (approximately translates to “vegetable meat” or “plant-based meat”) for plant-based meat in the Chinese survey instrument.
The questions in each survey were identical, apart from some demographic questions. We did not ask about political orientation in China due to a lack of cultural fit. Furthermore, the household income measures were adjusted to reflect local currencies and income strata. Questions about education, region, and ethnicity were also modified to reflect relevant variations between countries.
The Food Neophobia Scale contained minor modifications from the original measure (Pliner and Hobden, 1992), asking about “foods from other countries” rather than “ethnic foods” to make it more relevant to participants in India and China. Measures of behavioral intentions toward clean and plant-based meat were adapted from Wilks and Phillips 2017, p. 6), and modified to address common concerns about product availability and taste. Participants answered these questions about how likely they were to try, purchase regularly, eat in place of conventional meat, and pay more for clean and plant-based meat on a 5-point Likert scale, ranging from 1 (not at all likely) to 5 (extremely likely).
We used the same set of attitudinal questions when asking about clean meat, plant-based meat, and conventional meat. Participants gave their opinions on each type of meat using the following five-point semantic differential items: “Unhealthy—healthy, unnatural—natural, bad for the environment—good for the environment, unethical—ethical, unappealing—appealing, not tasty—tasty, unsafe—safe, expensive—affordable, bad for animals—good for animals, unsustainable as a long term food source—sustainable as a long term food source, inconvenient—convenient, boring—exciting, not nutritious—nutritious, unnecessary—necessary, bad—good, disgusting—not disgusting.”
The full survey instruments can be viewed in our OSF registration (https://osf.io/gav7z/).
Results
Data cleaning and analysis was conducted in accordance with our pre-registered analysis plan (https://osf.io/gav7z/). Where we deviated from the pre-registered plan for any reason, we have noted that in the following text. Data cleaning and analysis was conducted independently by two researchers and then compared to ensure accuracy.
Since we had age quotas, we did not specify a plan for removing participants who were under 18, but we found 7 of these in the Chinese sample. They were removed as well as one participant who entered their age as 200,023.
Descriptive Statistics
Tables showing the full demographic and acceptance data of each sample can be seen in the Supplementary Materials.
Demographics
We used quotas to ensure samples were representative of each country in terms of age and gender. The US sample was 47.7% male, 51.4% female, and 0.9% other genders; the mean age was 40.01 (SD = 11.86). The China sample was 49.5% male, 50.3% female, and 0.2% other genders; the mean age was 37.29 (SD = 9.26). The India sample was 50.5% male, 49.1% female, and 0.1% other genders; the mean age was 34.76 (SD = 8.86).
Whilst the US sample was relatively representative across other factors, the China and India samples skewed toward more urban-dwelling, well-educated, and high income participants compared to the general population. This was a skew we anticipated, since rural populations are less likely to have internet access in these countries. Whilst this means that these samples were not fully representative of the countries overall, they likely were representative of the populations who are most likely to have access to plant-based and clean meat in the near future. Full details of this can be seen in the Supplementary Materials.
Familiarity
Both familiarity with and acceptance of clean meat were substantially higher in India and China compared to in the USA. In the USA, 57.3% were not at all familiar with clean meat; 31.9% were slightly or moderately familiar, and just 10.8% were very or extremely familiar. In China, 35.5% were not at all familiar; 34.6% were slightly or moderately familiar, and 29.9% were very or extremely familiar. In India, 25.5% were not at all familiar; 35.8% were slightly or moderately familiar, and 38.7% were very or extremely familiar.
We found a somewhat similar pattern with regards to plant-based meat. In the US, 36.4% were not at all familiar with plant-based meat; 44.5% were slightly or moderately familiar, and 19.1% were very or extremely familiar. In China, 34.1% were not at all familiar with plant-based meat; 36.1% were moderately or slightly familiar, and 29.9% were very or extremely familiar. In India, 28.6% were not at all familiar with plant-based meat; 31.6% were slightly or moderately familiar, and 39.9% were very or extremely familiar.
These figures are likely a reflection of the skewed sample: plant-based and clean meat are not widely available or reported on in China and India, and there are few companies working on these technologies there. It is possible that some respondents over-reported their familiarity with these products, though it may simply be a reflection of the urban well-educated samples. Although we were careful to develop and translate clear descriptions of the products, we also cannot rule out the possibility that some participants did not fully understand them.
Acceptance
We see a similar pattern with regards to purchase likelihood, which was also substantially higher in China and India compared to in the USA. In the USA, 23.6% were not at all likely to purchase clean meat; 46.6% were somewhat or moderately likely, and 29.8% were very or extremely likely. In China, 6.7% were not at all likely to purchase clean meat; 33.9% were somewhat or moderately likely, and 59.3% were very or extremely likely. In India, 10.7% were not at all likely to purchase clean meat; 32.9% were somewhat or moderately likely, and 56.3% were very or extremely likely.
A similar pattern emerged with regards to purchase likelihood of plant-based meat. In the USA, 25.3% were not at all likely to purchase plant-based meat; 41.8% were slightly or moderately likely, and 32.9% were very or extremely likely. In China, 4.4% were not at all likely to purchase plant-based meat; 33.2% were somewhat or moderately likely, and 62.4% were very or extremely likely. In India, 5.5% were not at all likely to purchase plant-based meat; 31.7% were somewhat or moderately likely, and 62.8% were very or extremely likely.
Cross Country Comparisons
We ran one-way ANOVAs (analyses of variance) to compare the different countries surveyed on measures of (a) likelihood of purchasing clean meat, (b) likelihood of purchasing plant-based meat, (c) food neophobia, and (d) meat attachment. All of these variables were measured on a 1–5 scale, where 5 represents higher purchase likelihood, higher food neophobia, and higher meat attachment.
Some of the assumptions of ANOVA were violated in this case, although we believe that this analysis is still valid. Firstly, each of the variables returned significant (p < 0.001) values for the Shapiro-Wilk test of normality, indicating that they are not normally distributed (see Figures 1–4). However, the distributions are not extreme, and ANOVA is generally regarded as being robust to this assumption being violated (Schmider et al., 2010). Secondly, Levene's test indicated that the assumption of homogeneity of variance was also violated (p < 0.001). Therefore, we ran a Welch ANOVA, which does not require the homogeneity of variance assumption, and obtained extremely similar results. On this basis, we proceeded with ANOVAs.
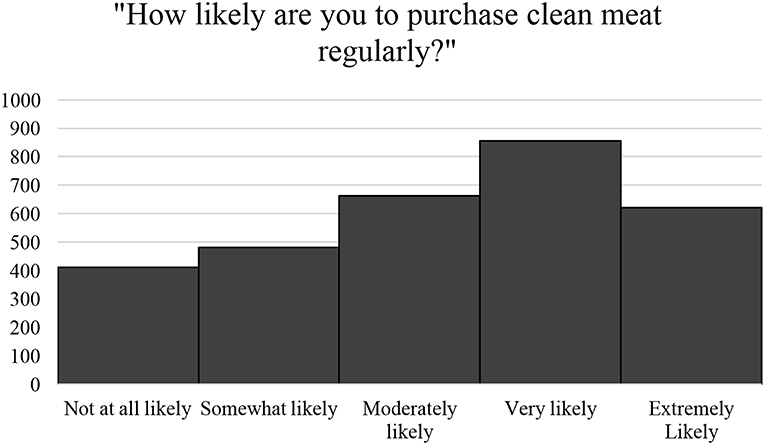
Figure 1. Histogram showing distribution of likelihood of purchasing clean meat.
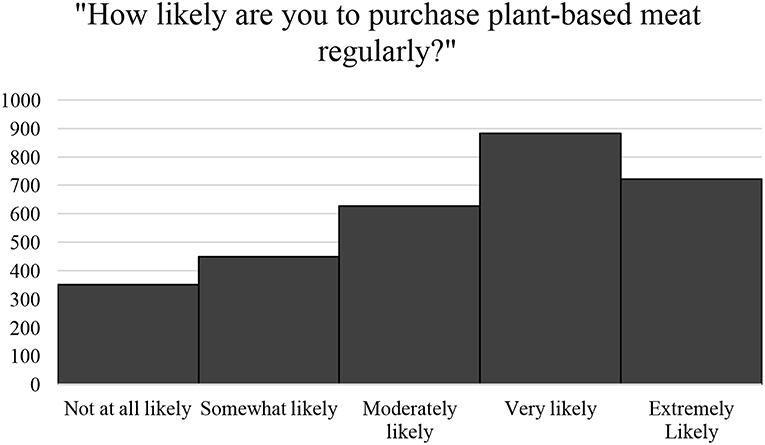
Figure 2. Histogram showing distribution of likelihood of purchasing plant-based meat.
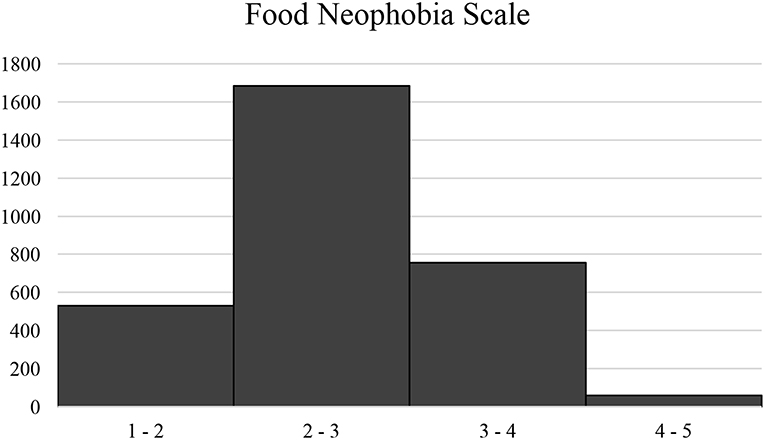
Figure 3. Histogram showing distribution of food neophobia scale.
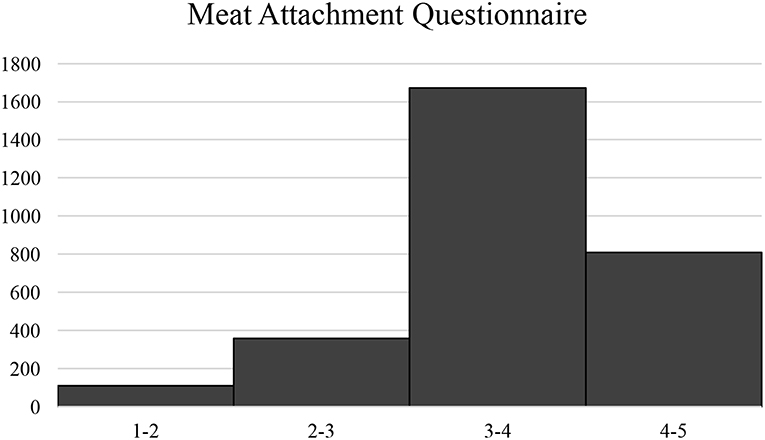
Figure 4. Histogram showing distribution of meat attachment questionnaire.
All of the ANOVAs returned significant results (p < 0.05). This was the case for likelihood of purchasing clean meat [F(2, 3027) = 132.51, p < 0.001], likelihood of purchasing plant-based meat [F(2, 3027) = 180.96, p < 0.001], food neophobia [F(2, 3027) = 6.15, p < 0.01], and meat attachment [F(2, 3027) = 132.10, p < 0.001].
Table 1 shows the mean score and standard deviation in each country. Pairwise comparisons were assessed using LSD post hoc tests in accordance with the data analysis plan. Within rows, mean values which are significantly different are denoted using different superscript letters. Values which share a superscript letter are not significantly different. For example, in the first row, the result in the US is significantly different from China and India, as shown by the differing superscript letters “a” in the US, and “b” in China and India. China and India, which are not significantly different, both share the superscript letter “b.”
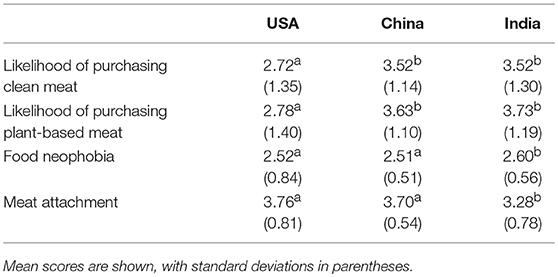
Table 1. ANOVA results showing omnibus results and pairwise comparisons.
As shown here, we find significantly higher likelihood of purchasing clean meat and plant-based meat in China and India compared to the USA (p < 0.01). We also find significantly lower meat attachment (p < 0.01), and significantly higher food neophobia (p < 0.01) in India compared to China and the USA.
The composite measure for meat attachment achieved good levels of reliability in the USA (α = 0.92), China (α = 0.80), and India (α = 0.88), but the results regarding food neophobia should be interpreted with greater caution. Although this composite measure was reliable in the US (α = 0.88), it was less reliable in China (α = 0.62) and India (α = 0.64). Whilst Nunnally (1978) has argued that α > 0.6 is an acceptable level of internal consistency, α > 0.7 is more commonly used (Churchill, 1979), and therefore this measure may be questionable in India and China. This may be due, in part, to the presence of items asking about both new food and food from different cultures. Whilst these form part of a coherent measure of food neophobia in the West, the concepts may be more distinct in China and India. Indeed, mean responses to items mentioning food from different cultures were amongst the most different from the overall scale mean in China and India.
To rule out the possibility that the higher rate of vegetarianism in India accounted for these latter two differences, we conducted further unplanned analyses in which we excluded vegetarians. We found that, when focusing on omnivores only, India still has a significantly lower meat attachment compared to China and the USA [F(2, 2757) = 48.68, p < 0.01]. When focusing on meat-eaters only, USA also has a significantly higher meat attachment than China (p < 0.01). The differences in food neophobia are still significant, also [F(2, 2757) = 3.25, p = 0.04]. India is significantly higher than the USA (p = 0.02) and China (p = 0.04).
Within Country Regressions
Next, we built linear regression models to identify demographic and attitudinal predictors of clean and plant-based meat acceptance within each country. Within each country, we ran two sets of regressions: one for clean meat (Table 2) and one for plant-based meat (Table 3). For clean meat models, likelihood of purchasing clean meat was the dependent variable; for plant-based meat models, likelihood of purchasing plant-based meat was the dependent variable.
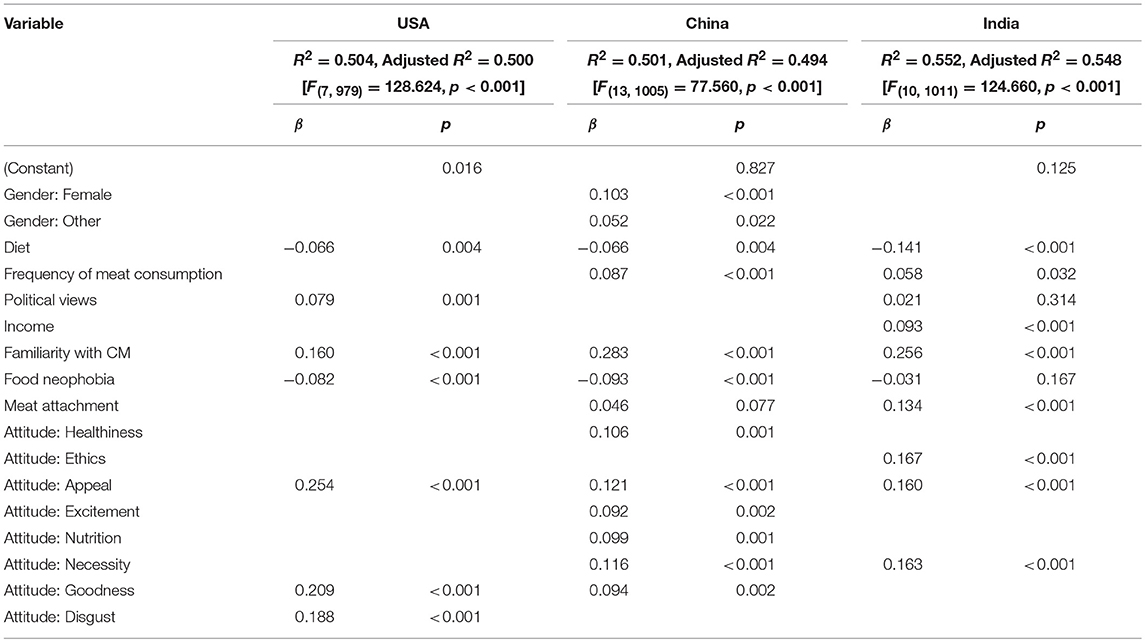
Table 2. Regression models showing significant predictors (standardized β) of intention to purchase clean meat in the USA, China, and India.
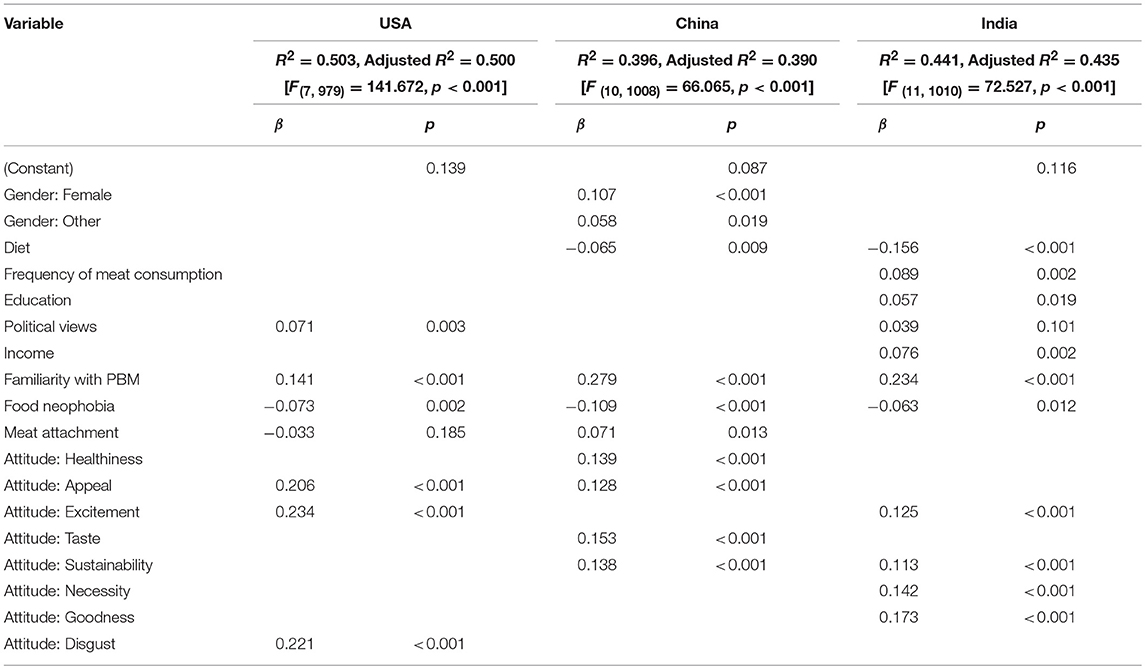
Table 3. Regression models showing significant predictors (standardized β) of intention to purchase plant-based meat in the USA, China, and India.
Linear regression models were built in three iterations. In the first iteration, the models included nine demographic variables: gender, age, diet, meat consumption frequency, education, politics (except in China), population density, income, and familiarity with the product. We then identified which of these were significant predictors of purchase likelihood, and dropped variables which were not significant predictors iteratively until all predictors were significant.
In the second iteration, we added Food Neophobia and Meat Attachment. We observed the change in R2, and proceeded if the change was significant at p < 0.05. Again, we dropped insignificant variables iteratively until all remaining variables were significant. However, in each iteration, we kept all variables from the previous iteration regardless of significance (i.e., we kept diet in the model, even though it lost significance when accounting for Food Neophobia in the second iteration). The only exception to this was gender in the clean meat model in the USA–in the first iteration, those identifying as other genders were significantly less likely to purchase compared to males. However, this was a small group of just 9 people, and this difference lost its significance in subsequent iterations. We therefore removed gender from the model to prevent overfitting.
In the third iteration, we added the 16 attitude variables (see section Materials) relating to clean or plant-based meat, as relevant. Again, we proceeded where the R2 change was significant at p < 0.05, and dropped insignificant variables iteratively. Our final models therefore included significant demographic as well as attitudinal predictors. This enabled us to identify which demographic groups are most likely to purchase clean meat, and what attitudes are key drivers of purchase intent within each country.
Clean Meat
With respect to clean meat, the final regression models were as follows:
In the USA, we find that those who follow pescatarian, vegetarian, or vegan diets are significantly less likely to purchase clean meat compared to omnivores. Purchase intention is also higher for those who are left-leaning politically, and for those who are more familiar with clean meat. Predictably, low food neophobia was a predictor of purchase intent; indeed, this was a predictor of purchase intent for clean meat and plant-based meat in every country. Whilst higher disgust predicted lower purchase likelihood, perceived appeal and goodness were predictors of higher purchase likelihood.
In China, we found that women were significantly more likely than men to buy clean meat. Purchase likelihood was also higher for meat-eaters (compared to vegetarians), and for those who ate more meat. Again, those more familiar with the concept were more likely to purchase it. We also found higher food neophobia predicted lower purchase likelihood, whilst higher meat attachment predicted higher purchase likelihood. Attitudinal predictors of purchase intent included perceived healthiness, appeal, excitement, nutrition, necessity, and goodness.
We find in India that omnivores and those who eat more meat are significantly more likely to purchase clean meat. We also find that those in higher income brackets, those who are more politically liberal, and those who are more familiar with the concept are more likely to purchase clean meat. Again, higher meat attachment and lower food neophobia are predictive of purchase intent. People were also more likely to purchase clean meat when they perceived it as ethical, appealing, and necessary.
Plant-Based Meat
With respect to plant-based meat, the final regression models were as follows:
In the USA, we found that more politically liberal people and those more familiar with the product were more likely to buy it. Meat attachment was found to be negatively predictive of acceptance, indicating that those who are especially attached to meat are relatively unlikely to buy plant-based meat. Attitudinal predictors of purchase intent included appeal, excitement, and low disgust.
In China, we again find that women are more likely than men to buy plant-based meat. Meat eaters are significantly more likely than vegetarians and vegans to buy plant-based meat, and higher meat attachment predicts higher purchase likelihood. Again, higher familiarity and lower food neophobia are predictive of purchase intent. The key attitudinal predictors of purchase intent were perceived healthiness, appeal, tastiness, and sustainability as a long term food source.
In India, we find omnivores and those who eat more meat are again more likely to eat plant-based meat. Higher income groups in India expressed more interest in plant-based meat, as did more educated and more politically liberal consumers. Familiarity with the products was strongly predictive of purchase intent, and food neophobia predicted lower purchase intent. In terms of attitudes, perceived sustainability, excitement, necessity, and goodness were predictors of plant-based meat purchase intent in India.
Discussion
The most consequential finding of this study is the significantly higher likelihood of urban, well-educated and high income consumers in India and China purchasing clean meat and plant-based meat compared to consumers in the USA. Most consumer research thus far has focused disproportionately on the West, leaving emerging markets relatively unexplored (Bryant and Barnett, 2018, p. 16). Our findings indicate that these markets represent high-value opportunities for plant-based and clean meat producers, most of which are US-based. In the case of China, there is reason to believe that the government is supportive of advanced agricultural technology for its environmental, food safety, and food security benefits, though the reporting doesn't offer insight on whether this specifically extends to clean meat (Reuters, 2017).
Furthermore, these markets may represent especially good opportunities to displace demand for conventional meat. The findings in India and China indicate that those who eat more meat, and are more attached to meat, are more likely to purchase plant-based and clean meat. In terms of reducing the impact of conventional meat on the environment and animal suffering, aiming at markets in China and India may have particularly high potential.
We cannot ignore, however, the large skew toward more urban, more educated, and higher income populations in our China and India samples compared to the general population. This was partly by design. As we discuss in our pre-registration documentation, affluent educated city-dwellers are the population most likely to have access to clean and plant-based meat. Moreover, whilst these are characteristics that have been associated with higher acceptance of clean meat in the West (Flycatcher, 2013, p. 18; Tucker, 2014, p. 174), this may not be the case in China and India. Indeed, these characteristics rarely emerged as predictors in our regression models. Furthermore, we see some commonly observed demographic trends such as higher acceptance amongst men compared to women (Bryant and Barnett, 2018, p. 12) reversed in China. Therefore, the effect of this skewed data is unclear, and is unlikely to account for all of the large differences observed.
Other limitations include a variety of issues commonly associated with self-reported data. As well as poor recollection (e.g., of foods consumed) and poor ability to predict one's own future behavior (e.g., with regard to clean meat), it is likely that respondents will have exhibited a degree of social desirability bias (i.e., an inclination to give answers that make them look good). These are perennial issues with respect to self-reported survey responses, though we have tried to mitigate them by informing participants in the briefing that they should answer as honestly as they can.
Moreover, we do not know the extent to which participants' answers will have been affected by earlier questions. For example, participants' answers about clean and plant-based meat may have been affected by answering earlier questions about their attitudes to conventional meat and new food in general. We have tried to control for such priming effects by partially randomizing the order of question blocks and questions within blocks. However, some questions always come before others, and in this case, we cannot rule out the possibility that participants were primed by earlier questions when answering the key variables.
Finally, it is possible that people in different countries answer survey questions differently in general. For example, Faunalytics (2018) observed that survey respondents in China were more likely to acquiesce to statements and were more likely to give responses in the middle of scales than respondents in the U.S. Whilst it is difficult to assess whether such patterns represent differences in survey answering styles or real differences in attitudes, we tried to minimize such differences in this study by ensuring that the China survey instrument was back-translated and had equivalent meaning in China as in the U.S.
Different Strategies for Different Markets
Differences between regression models imply that different market strategies may be appropriate in US, Chinese, and Indian markets.
In the USA, we find that meat-eaters are most likely to express interest in purchasing clean meat, replicating the finding of Wilks and Phillips (2017, pp. 10–11). We also found that meat attachment predicted lower purchase likelihood of plant-based meat, but not of clean meat. This implies that plant-based and clean meat could cater to different markets in the US: whilst plant-based meats may be appealing to those low in meat attachment, clean meat may play a crucial role in displacing demand for conventional meat amongst those who do not find plant-based meat appealing.
We also found that disgust was a significant predictor of plant-based and clean meat acceptance, a finding which was unique to the USA. Disgust is commonly discussed as a mechanism for rejection in clean meat research amongst Western consumers (Verbeke et al., 2015, p. 52; Siegrist et al., 2018, p. 217), though it is interesting that this was not the case in India and China. This has implications for marketers in the USA, where disgust is an important reaction to overcome.
In China, we see an interesting reversal of a commonly observed demographic variation in the West with respect to clean meat acceptance: gender. Whilst it is common to observe higher acceptance amongst men compared to women in the West (Bryant and Barnett, 2018, p. 12), this data shows higher purchase intent amongst women compared to men in China. It is not entirely clear why this is the case, though Nath (2011) has posited that Western construals of masculinity might account for higher willingness to eat unfamiliar foods in the West.
We also find an interesting set of attitudinal predictors for both plant-based and clean meat acceptance in China: perceived healthiness predicted higher purchase intent for plant-based and clean meat, and perceived nutritional value also predicted higher acceptance of clean meat. This implies that modifications to increase health and nutrition profiles compared to conventional meat (such as decreasing saturated fat content or increasing omega fatty acids) may be particularly welcome in China. Excitement as well as perceived goodness and necessity also predicted purchase likelihood of clean meat, indicating that some consumers will find clean meat appealing as a novel solution to problems of conventional meat.
In India, perceived necessity was again a predictor of both plant-based and clean meat acceptance, whilst perceived sustainability predicted plant-based meat acceptance and perceived ethicality predicted clean meat acceptance. This seems to suggest that consumers in India, who had the lowest levels of meat attachment, are most cognizant of the environmental and ethical issues with conventional meat. Messages about the environment and animal welfare may be more effective marketing strategies in India compared to China and the USA.
Whilst there were substantial differences between countries in terms of demographic and attitudinal predictors of plant-based and clean meat acceptance, several factors recurred consistently across countries. Firstly, lower food neophobia and higher familiarity predicted acceptance of both plant-based and clean meat in every country. This is good evidence confirming the idea that increased familiarity with these new food technologies will likely cause increased willingness to eat them (Bryant and Barnett, 2018, p. 12). This seems to be the case across cultures, and likely means that acceptance will increase over time, as consumers become more familiar with the products.
Political orientation was also a consistent predictor of purchase likelihood across countries. We did not ask about political orientation in China, but in the USA and India, we consistently found that more liberal people reported a higher likelihood of purchasing plant-based and clean meat. This may be a result of left-leaning people placing higher value on universalism and benevolence, and a lower value on conformity and tradition (Caprara et al., 2006, p. 16). It may also reflect the correlation between political conservatism and disgust sensitivity (Inbar et al., 2012, pp. 539–540).
Conclusion
This study was the first to quantitatively compare consumer acceptance of plant-based and clean meat between the USA and Asia. Some research has compared acceptance across countries (Surveygoo, 2018) and amongst Chinese consumers (Bekker et al., 2017), though the studies were very limited in scope. As an exploration of consumer demand in China and India overall, the present study is limited by a highly skewed sample. However, as an exploration of consumer demand in the markets which will have access to plant-based and clean meat, this is the most comprehensive study to date exploring market demand in India and China.
There is room for more research exploring consumer acceptance of plant-based and clean meat in different countries. As we note, most surveys have differed in their question wording, response options, and terminology, so their outcomes are often not comparable between countries. For this reason, future studies aiming to compare acceptance in unexplored countries might consider using the same survey instruments as previous studies, or distributing the same survey instrument in the USA for comparison. Given the high acceptance in China and India, further investigation into consumer acceptance there may be warranted.
Future research could also address the ways social and policy context might affect consumer attitudes toward clean and plant-based meat. One example is exploring how consumer perceptions change as clean meat products come to market, and come out of the shadows of being perceived as a mysterious future technology. This could also be a fertile area for research exploring what role regulation plays in individuals' judgements of food safety. Research might also explore the extent to which clean meat enthusiasts are “reluctant omnivores”–i.e., consumers who recognize the moral arguments for vegetarianism, but still want to eat meat regardless. Given that clean meat is most appealing to meat-eaters, this may likely be the case.
Whilst there are a multitude of unexplored factors which could affect consumer acceptance of clean and plant-based meat, this study has demonstrated the importance of China and India as potential future markets. All three markets are substantial, with consumers in China and India showing even more initial interest than the US. These findings indicate that consumer demand in the three most populous countries will be ready when producers begin supplying these markets.
Data Availability
The data generated for this study can be found at the OSF: https://osf.io/gav7z/.
Author Contributions
CB, KS, NP, and VD: conceptualization and funding application; CB, KS, NP, VD, and BT: research design and survey instrument; CB: ethics application and writing manuscript; BT: translation; KS: data collection; NP and CB: data analysis; KS, NP, and VD: editing manuscript.
Funding
Funding for this project was granted by the Animal Advocacy Research Fund, which aims to support research that contributes to an understanding of effective animal advocacy. The researchers are funded by the Economic and Social Research Council CB and The Good Food Institute KS and VD.
Conflict of Interest Statement
CB is the Director of Social Science at the Cellular Agriculture Society, which aims to promote cellular agriculture. KS (Senior Consumer Research Scientist), VD (Managing Director for India), and NP (Research Fellow) are employed by/associated with The Good Food Institute, which aims to promote plant-based and clean meat. BT is a Research Fellow at The Good Food Institute, and consults for the Open Philanthropy Project.
Acknowledgments
We would also like to thank Maria Chen of the University of British Columbia for her help with translations, and Jo Anderson of Faunalytics for her help with analysis advice.
Supplementary Material
The Supplementary Material for this article can be found online at: https://www.frontiersin.org/articles/10.3389/fsufs.2019.00011/full#supplementary-material
References
Bekker, G. A., Tobi, H., and Fischer, A. R. H. (2017). Meet meat: an explorative study on meat and cultured meat as seen by Chinese, Ethiopians and Dutch. Appetite 114, 82–92. doi: 10.1016/j.appet.2017.03.009
Bryant, C., and Barnett, J. (2018). Consumer acceptance of cultured meat: a systematic review. Meat Sci. 143, 8–17. doi: 10.1016/j.meatsci.2018.04.008
Caprara, G. V., Schwartz, S., Capanna, C., Vecchione, M., and Barbaranelli, C. (2006). Personality and politics: values, traits, and political choice. Polit. Psychol. 27, 1–28. doi: 10.1111/j.1467-9221.2006.00447.x
Churchill, G. A. Jr. (1979). A paradigm for developing better measures of marketing constructs. J. Market. Res. 16, 64–73. doi: 10.1177/002224377901600110
Eurobarometer (2005). Social Values, Science and Technology. Available online at: http://ec.europa.eu/commfrontoffice/publicopinion/archives/ebs/ebs_225_report_en.pdf (Accessed October 25, 2018).
Faunalytics (2018). Attitudes Toward Farmed Animals in the BRIC Countries. Available online at: https://faunalytics.org/wp-content/uploads/2018/09/BRIC-Full-Report.pdf (Accessed January 14, 2019).
Flycatcher (2013). Kweekvlees [Cultured Meat]. Netherlands. Available online at: http://www.flycatcherpanel.nl/news/item/nwsA1697/media/images/Resultaten_onderzoek_kweekvlees.pdf (Accessed October 25, 2018).
Food Agriculture Organization (2011). World Livestock 2011: Livestock in Food Security. Rome: Food and Agriculture Organization. Available online at: http://www.fao.org/docrep/014/i2373e/i2373e.pdf (Accessed October 25, 2018).
Good Food Institute (2018). Plant-Based Meat Production 101. Available online at: https://www.gfi.org/plant-based-meat-production-101 (Accessed January 14, 2019).
Graça, J., Calheiros, M. M., and Oliveira, A. (2015). Attached to meat?(Un) Willingness and intentions to adopt a more plant-based diet. Appetite 95, 113–125. doi: 10.1016/j.appet.2015.06.024
Hoek, A. C., Luning, P. A., Weijzen, P., Engels, W., Kok, F. J., and de Graaf, C. (2011). Replacement of meat by meat substitutes. A survey on person-and product-related factors in consumer acceptance. Appetite 56, 662–673. doi: 10.1016/j.appet.2011.02.001
Inbar, Y., Pizarro, D., Iyer, R., and Haidt, J. (2012). Disgust sensitivity, political conservatism, and voting. Soc. Psychol. Personal. Sci. 3, 537–544. doi: 10.1177/1948550611429024
Johnson, T. P. (1998). Approaches to equivalence in cross-cultural and cross-national survey research. ZUMA-Nachrichten Spezial 3, 1–40.
Kotrlik, J. W., and Higgins, C. C. (2001). Organizational research: determining appropriate sample size in survey research appropriate sample size in survey research. Inform. Technol. Learn. Perform. J. 19, 43–50.
McMichael, A. J., Powles, J. W., Butler, C. D., and Uauy, R. (2007). Food, livestock production, energy, climate change, and health. Lancet 370, 1253–1263. doi: 10.1016/S0140-6736(07)61256-2
Nath, J. (2011). Gendered fare? A qualitative investigation of alternative food and masculinities. J. Sociol. 47, 261–278. doi: 10.1177/1440783310386828
Pliner, P., and Hobden, K. (1992). Development of a scale to measure the trait of food neophobia in humans. Appetite 19, 105–120. doi: 10.1016/0195-6663(92)90014-W
Post, M. J. (2012). Cultured meat from stem cells: challenges and prospects. Meat Sci. 92, 297–301. doi: 10.1016/j.meatsci.2012.04.008
Reuters (2017). Israel and China Sign $300 Million ‘Clean-tech’ Trade Agreement. Available online at: https://www.reuters.com/article/us-israel-china-cleantech/israel-and-china-sign-300-million-clean-tech-trade-agreement-idUSKCN1BM13E (Accessed January 14, 2019).
Schmider, E., Ziegler, M., Danay, E., Beyer, L., and Buhner, M. (2010). Is it really robust? Reinvestigating the robustness of ANOVA against violations of the normal distribution assumption. Methodology 6, 147–151. doi: 10.1027/1614-2241/a000016
Siegrist, M., Sütterlin, B., and Hartmann, C. (2018). Perceived naturalness and evoked disgust influence acceptance of cultured meat. Meat Sci. 139, 213–219. doi: 10.1016/j.meatsci.2018.02.007
Surveygoo (2018). Nearly One in Three Consumers Willing to Eat Lab-Grown Meat, According to New Research. Available online at: https://www.datasmoothie.com/@surveygoo/nearly-one-in-three-consumers-willing-to-eat-lab-g/ (Accessed October 25, 2018).
Tucker, C. A. (2014). The significance of sensory appeal for reduced meat consumption. Appetite 81, 168–179. doi: 10.1016/j.appet.2014.06.022
Verbeke, W., Marcu, A., Rutsaert, P., Gaspar, R., Seibt, B., Fletcher, D., et al. (2015). ‘Would you eat cultured meat? Consumers’ reactions and attitude formation in Belgium, Portugal and the United Kingdom. Meat Sci. 102, 49–58. doi: 10.1016/j.meatsci.2014.11.013
Wild, F., Czerny, M., Janssen, A. M., Kole, A. P. W., Zunabovic, M., and Domig, K. J. (2014). The evolution of a plant-based alternative to meat. From niche markets to widely accepted meat alternatives. Agro Food Ind. Hi Tech. 25, 45–49.
Wilks, M., and Phillips, C. J. (2017). Attitudes to in vitro meat: a survey of potential consumers in the United States. PLoS ONE 12:e0171904. doi: 10.1371/journal.pone.0171904
YouGov (2013). No British Demand for Fake Meat. Available online at: https://yougov.co.uk/news/2013/08/05/no-demand-fake-meat/ (Accessed October 25, 2018).
YouGov (2018). No Demand for Fake Meat. Available online at: https://china.yougov.com/en-cn/news/2018/02/22/no-demand-for-fake-meat/ (Accessed October 25, 2018).
Keywords: clean meat, cultured meat, cell-based meat, plant-based meat, consumer acceptance, consumer behavior
Citation: Bryant C, Szejda K, Parekh N, Deshpande V and Tse B (2019) A Survey of Consumer Perceptions of Plant-Based and Clean Meat in the USA, India, and China. Front. Sustain. Food Syst. 3:11. doi: 10.3389/fsufs.2019.00011
Received: 26 October 2018; Accepted: 08 February 2019;
Published: 27 February 2019.
Edited by:
Cor Van Der Weele, Wageningen University & Research, NetherlandsReviewed by:
Raul Rodriguez-Herrera, Universidad Autónoma de Coahuila, MexicoJacy Reese, Sentience Institute, United States
Copyright © 2019 Bryant, Szejda, Parekh, Deshpande and Tse. This is an open-access article distributed under the terms of the Creative Commons Attribution License (CC BY). The use, distribution or reproduction in other forums is permitted, provided the original author(s) and the copyright owner(s) are credited and that the original publication in this journal is cited, in accordance with accepted academic practice. No use, distribution or reproduction is permitted which does not comply with these terms.
*Correspondence: Christopher Bryant, c.j.bryant@bath.ac.uk