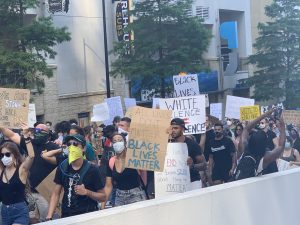
In light of the national uprising sparked by the murders of George Floyd and Breonna Taylor (and building on other recent tragic movement moments going back to the 2014 murder of Michael Brown in Ferguson, Missouri), NCRP is analyzing grantmaking by community foundations across the country to find out exactly how much they are – or are not – investing in Black communities.
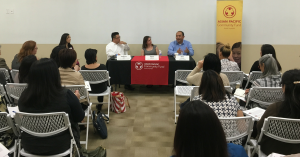
We started by looking at the latest available grantmaking data (2016-2018) of 25 community foundations (CFs) – from Los Angeles to New Orleans to New York City to St. Paul. These foundations represent a cross section of some of the country’s largest community foundations as well as foundations in communities where NCRP has Black-led nonprofit allies. [1]
What did we find?
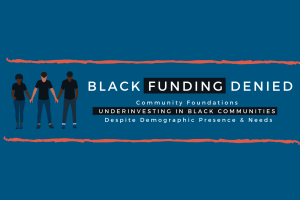
CONTINUED UNDERINVESTMENT, DESPITE INTENTIONS & DEMOGRAPHICS
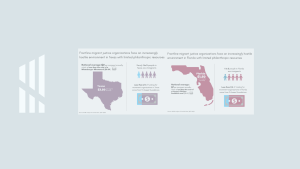
Altogether, only 1% of grantmaking from the 25 foundations that we looked at was specifically designated for Black communities, even though a combined 15% of these 25 cities’ populations are Black.
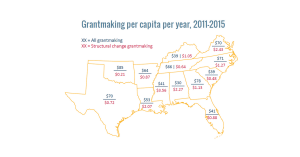
Put another way, these 25 foundations together designated $78 in funding per person in their communities, but only explicitly designated $6 per Black person in their communities.
| Updated Numbers & Analysis This report was originally published in August of 2020. In March 2023, NCRP’s Katherine Ponce examined the lessons learned since then, including looking at the updated numbers. Sept. 2020 Editor’s Note In an effort to further clarify our point and methodology, we have edited several parts of the report to make it clear that we are discussing community foundation grants that were specifically targeted to or explicitly designated for the Black Community. Click here for more details |
grants explicitly designated for Black communities (2016-2018) | City Population |
||
|---|---|---|---|
Find more detailed funding information per community foundation
on these Tableau and Excel sheets
These 25 foundations also designated a greater percentage on direct services, but less on structural change, in the general population than they did per Black person. Of the $78 designated per capita on the general population, $52 (66.7%) was designated for direct services and $2.42 on structural change (3.1%). Of the $6 explicitly designated per Black person, $0.51 (8.3%) was designated for structural change and $3.66 (61%) was spent on direct services.
THE EVER-PERSISTENT RESOURCE GAP
The gap between actual community foundation support for Black communities and what we would expect to observe translates into real dollars that are could be used address issues that impact us all. If community foundations explicitly designated investments for Black communities on a per capita basis like they invested in the general population, Black communities in these cities alone would have been the beneficiaries of $2 billion more in grantmaking since 2016.[2]
With the median annual budget (as measured by total expenses reported on forms 990) for organizations in the racial and ethnic minority rights NTEE code category being $445,000, an extra $2 billion could have easily powered hundreds or even thousands of new grassroots Black-led social change organizations, significantly expanding the 501(c)3 and (c)4 ecosystem for the work of Black liberation.
The Black investment rate disparity of these community foundations is, surprisingly, far worse than some other notable measures of inequality. The 25 community foundations that we examined designated grants for non-Black communities at a rate 13 times more than they have explicitly designated for Black communities since 2016. In Q4 of 2019, the median weekly paycheck for white Americans was 1.2 times that for Black Americans.[3] In 2016, median white household wealth was 10 times that of Black households. [4]
Sadly, these conclusions are not new. Our current data snapshot builds on decades of research by the Philanthropic Initiative for Racial Equity (PRE), The Association of Black Foundation Executives (ABFE), Greenlining Institute and others describe philanthropy’s massive under-investment in communities of color and in Black communities specifically. PRE and ABFE’s research has shown total philanthropic support for Black communities hovering at around 1.8%. It appears that these community foundations aren’t even keeping up with the abysmal standards nationally set by their peers.
Proportional funding is also just the start of the equity conversation, not the end.
It is certainly arguable whether decades of financial underinvestment by both the philanthropic sector and other sectors of society can simply be undone by tying funding amounts alone to population data, especially considering the traditional undercounting issues surround Census data, as well the longstanding accuracy issues with philanthropy sector-related data.
Foundations looking to deeply tackle the issue should start by having an honest dialogue with the Black-led, Black-serving organizations in their communities. What are their assets and strengths? Their priorities? How can the foundation deploy its resources to the benefit of the whole community and not just part?
Funding Black communities at a rate commensurate with their relative size is a floor for equitable funding, not a ceiling.
NOW IS THE TIME TO MATCH OUR INTENTIONS WITH FUNDING ACTIONS
Community foundations are not like other grantmakers. They receive a public subsidy above and beyond that available to private foundations (e.g. the Ford Foundation) by nature of their commitment to raising funds from the public instead of just one person or family. And in order to raise funds for community use, they rely on their reputation as a foundation focused on a whole community instead of a specific cause or issue area. Choosing to direct 99% of their grantmaking away from Black communities undermines the community foundation brand.
Many people who work in these foundations will be painfully aware of this data. Many will ask either internally or publicly whether it’s fair to judge their institutions with data that is from 2 years ago. So much has changed since then. So many foundations have stepped up to provide support in ways that they haven’t before.
Yet, while it is important to remember the good work that many community foundations are attempting to do in the current moment, it is equally important to put these commitments alongside the overall spending numbers of these organizations — both current and traditional. Consider this: Even if community foundation giving for Black communities had tripled since 2018 — which would represent a seismic shift in grantmaking priorities — it still would not even amount to 4% of all giving in these cities.
The bottom line is that community foundations have neglected their charge to serve their full communities. Regardless of why, we must be immediately address how Black Americans have been excluded from community foundation grantmaking writ large.
With COVID-19 continuing disproportionately negatively impact Black communities, and as the country is gripped by a national reckoning about the role of white supremacy in our public life, this “redlining by another name” – as ABFE described it – is holding us all back.
CORRECTION(S)
The gap between current funding and funding/population parity for Black communities over the three years in question is $2 billion, not $200 billion, as was originally reported.
ENDNOTES
1. Additional details about the report’s data methodology, can be found in the report’s Methodology section below and the report’s FAQ page
2. The original version of the report contained typo that has been corrected. The gap between current funding and funding/population parity for Black communities over the three years in question is $2 billion, not $200 billion. If you have questions about this or other methodology questions contact NCRP’s Research Director Ryan Schlegel at rschlegel[at]ncrp.org. (Updated 8/27/2020)
3. https://inequality.org/facts/racial-inequality/
4. https://apps.urban.org/features/wealth-inequality-charts/
METHODOLOGY
The data in this brief report is based on NCRP’s analysis of Candid giving data, which we paired with Census (ACS, 2018) demographic data. Candid (formerly GuideStar + Foundation Center) is the definitive philanthropy sector source for information on foundation grantmaking.
NCRP’s query of Candid data includes grantmaking
- from each community foundation,
- for work to benefit the community foundation’s home state (or states in cases where the foundation serves a multi-state community)
- from 2016 to 2018
Grantmaking for Black communities includes all grants to which Candid assigned the “People of African Descent” beneficiary population code.
Grantmaking for structural change includes all grants to which Candid assigned the “Democracy” or “Human Rights” subject codes.
Grantmaking for direct services includes all grants to which Candid assigned the “Education,” “Health,” or “Human Services” subject codes.
Demographic statistics used in the per capita funding calculations are from the Census 2018 American Community Survey and pertain to the metropolitan area where each community foundation is based as defined by the
Census Bureau. Black per capita funding statistics pertain to the Black population numbers, total per capita funding statistics pertain to total population numbers.
More answers to Frequently Asked Questions about our data can be found here: https://www.ncrp.org/news/faq-black-funding-denied-data-report
CREDITS
Initial writing and data analysis spearheaded by NCRP Director of Research Ryan Schlegel and compiled by Senior Associate for Movement Research Stephanie Peng and Research & Development intern Spencer Ozer. Additional writing and editing provided by Director of Marketing and Membership Janay Richmond, Vice President and Chief Engagement Officer Jeanne Lewis and the NCRP Communications staff of Elbert Garcia and Peter Haldis.


Leave a Reply