
Improved Estimates of the Industry Economic Accounts
Results of the 2018 Comprehensive Update
Taylor M. Grant and Blaire Thomson contributed to the analysis in this article.
On November 1st, the Bureau of Economic Analysis (BEA) released estimates of real gross domestic product (GDP) by industry for the second quarter of 2018, revised annual estimates for 1997 through 2017, and revised quarterly estimates for the first quarter of 2005 through the first quarter of 2018. The revised estimates reflect the results of the 2018 comprehensive update to the Industry Economic Accounts (IEAs). These accounts provide statistics on interactions among industries and the roles these industries play in the economy, including each industry’s contribution to GDP.
Additionally, the release includes the new 2012 supply-use tables (SUTs) as well as updated 2007 benchmark SUTs. The benchmark SUTs provide a detailed picture of the economy, showing relationships among approximately 405 industries and commodities. They serve as the statistical foundation for other BEA estimates, as they are fully integrated with the annual industry accounts and the National Income and Product Accounts (NIPAs). The full time series of annual SUTs, providing information on 71 industry categories, has been updated to be consistent with the benchmark tables.
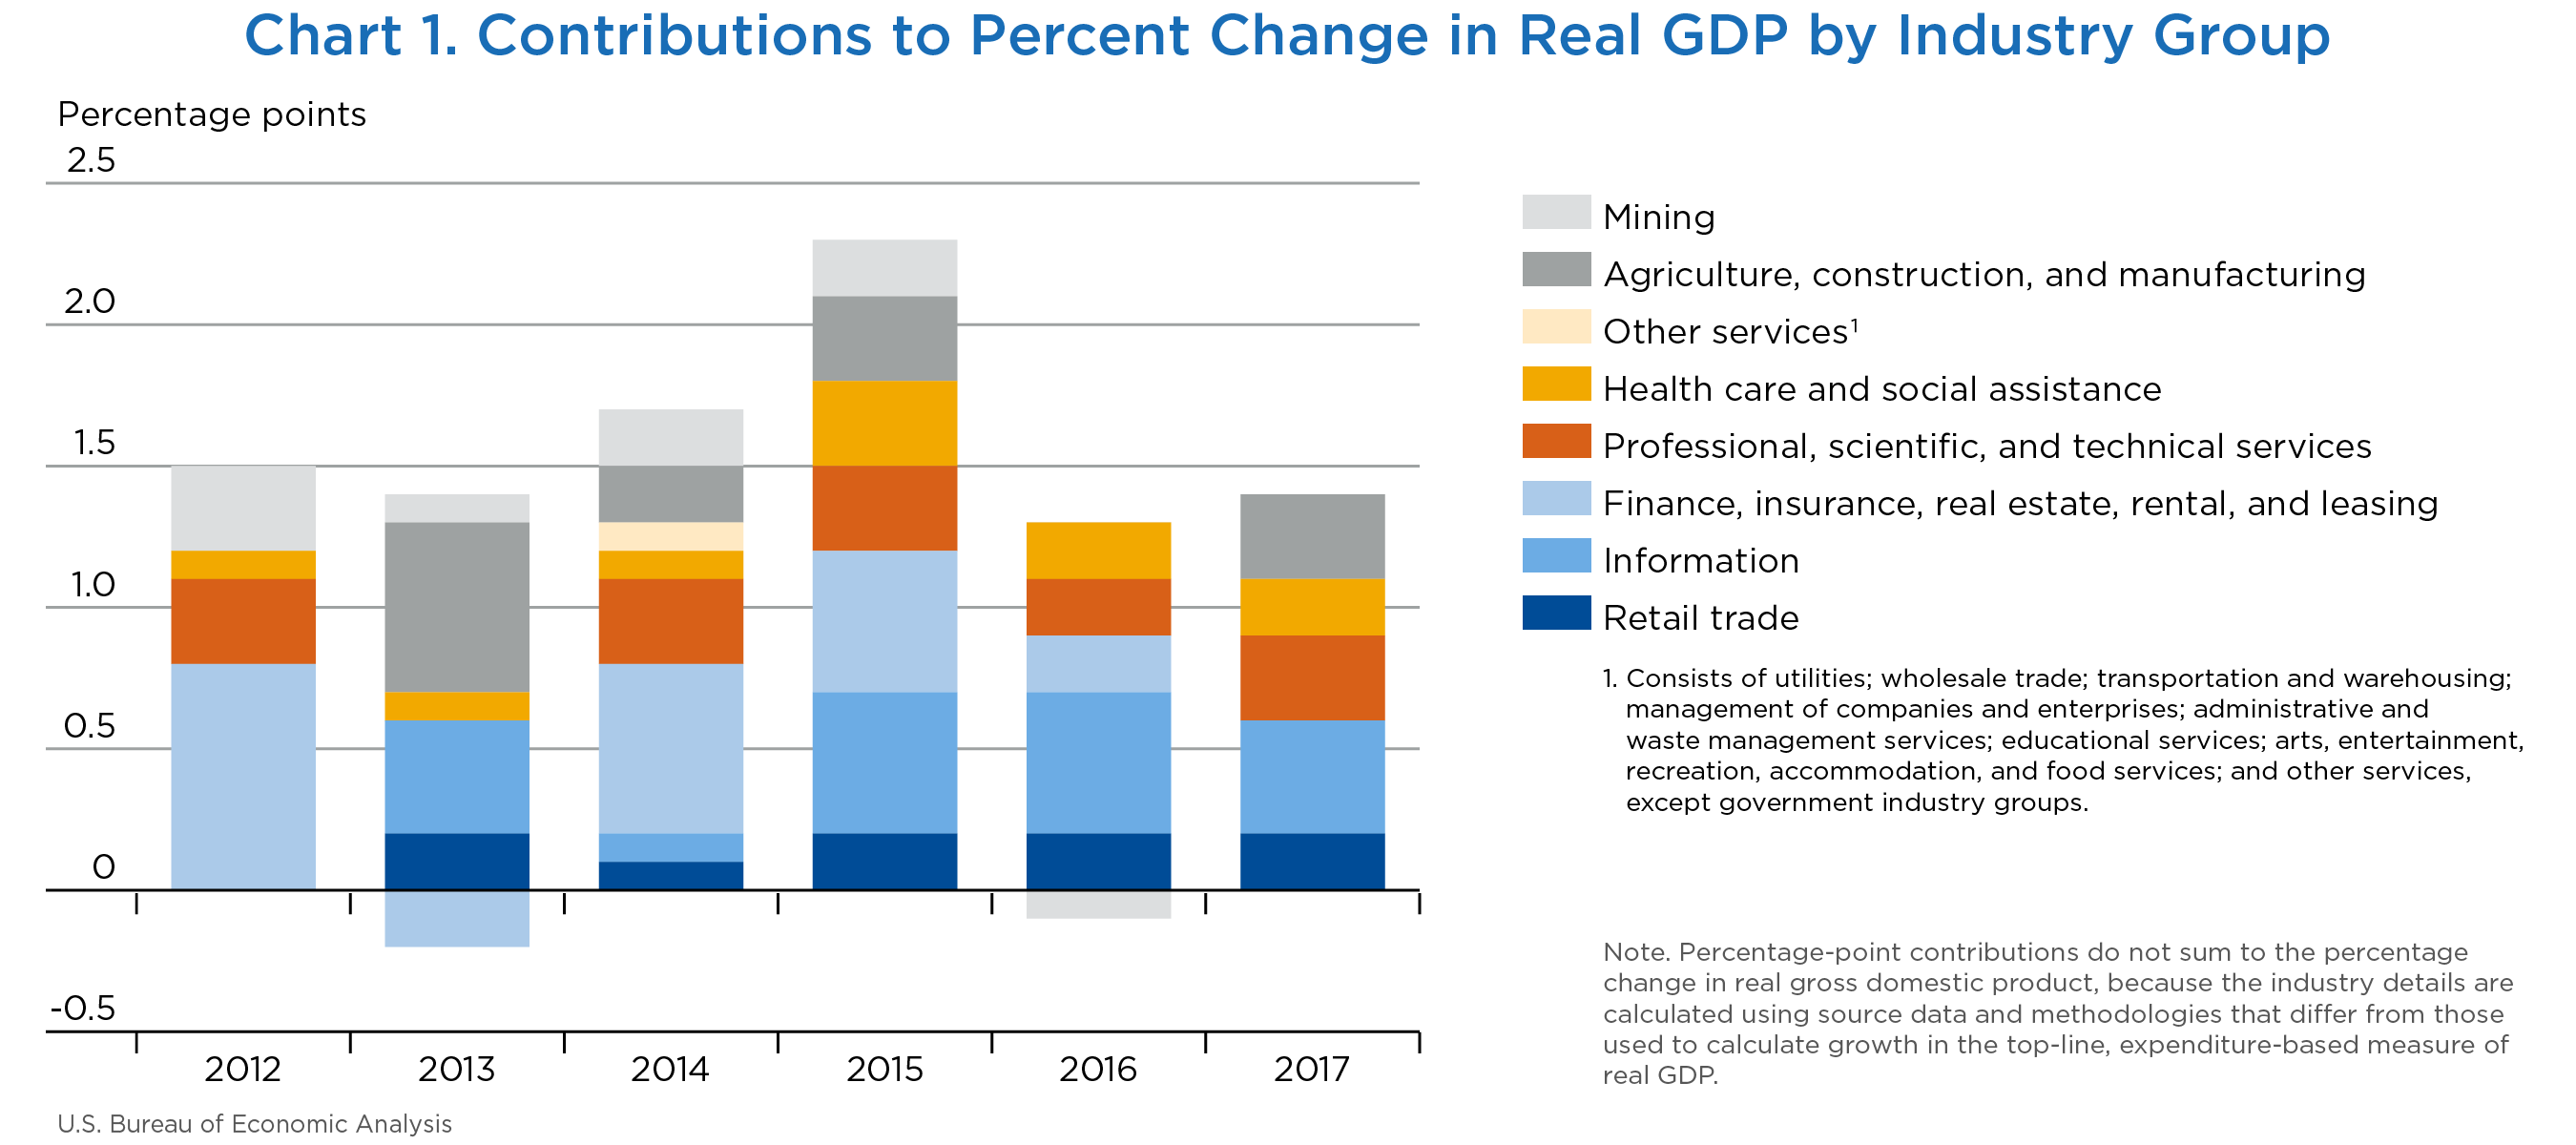
The statistics show that 16 of 22 major industry groups contributed to an overall 4.2 percent increase in real GDP in the second quarter. Economic growth was led by information; real estate and rental and leasing; and professional, scientific, and technical services. Together, these industries contributed 2.08 percentage points to overall growth (chart 1).
[Click chart to expand]
Estimates of real gross output and real intermediate inputs are available for both annual and quarterly IEA statistics. Annual statistics are available for 1947 forward.1 In addition, annual statistics for 138 industries are now available as part of the underlying detail for the IEAs for 1997 forward. Quarterly statistics are now available at the expanded 71 industry publication level for the first quarter of 2005 forward.
Table 1 shows the percent changes in real value added in the second quarter of 2018 by major industry group.
- Real GDP increased at a 4.2 percent annualized rate in the second quarter of 2018. Overall, 16 of 22 major industry groups contributed to GDP growth.
- Information, the leading contributor to GDP growth, increased 13.4 percent in the second quarter after increasing 4.3 percent. The second-quarter increase was driven by a 30.3 percent increase in data processing, internet publishing, and other information services.
- Real estate and rental and leasing, the second leading contributor to GDP growth, increased 5.3 percent after increasing 2.7 percent. This is the largest growth rate since the third quarter of 2013. This growth primarily reflected an 18.0 percent increase in other real estate.
- Professional, scientific, and technical services increased 9.3 percent, the largest increase since the third quarter of 2014, after increasing 6.0 percent. The increase was led by a 9.2 percent increase in miscellaneous professional, scientific, and technical services.
- Mining increased 11.7 percent after decreasing 18.0 percent. This growth was mainly driven by an 8.0 percent increase in oil and gas extraction.
- Health care and social assistance increased 4.7 percent after increasing 4.6 percent, primarily reflecting a 7.0 percent increase in ambulatory health care services.
- Durable-goods manufacturing increased 7.3 percent after decreasing 4.7 percent, the strongest growth rate since the third quarter of 2014. The increase primarily reflected an 18.4 percent increase in motor vehicles, bodies and trailers, and parts manufacturing.
- Nondurable goods decreased 3.7 percent after increasing 12.1 percent. The second-quarter decrease was attributed to a 36.1 percent decrease in petroleum and coal products, which was partially offset by a 7.1 percent increase in chemical products.
- Finance and insurance decreased 2.0 percent after decreasing 5.5 percent. The decrease was driven by a 15.0 percent decrease in securities, commodity contracts, and investments.
| Line | 2017 | 2018 | |||||
|---|---|---|---|---|---|---|---|
| I | II | III | IV | I | II | ||
| 1 | Gross domestic product | 1.8 | 3.0 | 2.8 | 2.3 | 2.2 | 4.2 |
| 2 | Private industries | 1.7 | 3.1 | 2.9 | 2.3 | 2.3 | 4.4 |
| 3 | Agriculture, forestry, fishing, and hunting | −4.8 | −7.8 | −9.1 | −4.9 | −8.2 | 8.5 |
| 4 | Mining | 4.3 | 30.8 | 14.1 | −5.0 | −18.0 | 11.7 |
| 5 | Utilities | −10.3 | 9.4 | −6.3 | 8.4 | −7.2 | 19.1 |
| 6 | Construction | 1.5 | −2.8 | 1.0 | 6.7 | 4.0 | 2.6 |
| 7 | Manufacturing | 7.8 | 3.5 | 0.9 | 6.8 | 7.9 | 2.3 |
| 8 | Durable goods | 3.5 | 4.6 | 6.1 | 6.9 | 4.7 | 7.3 |
| 9 | Nondurable goods | 13.8 | 2.1 | −5.4 | 6.7 | 12.1 | −3.7 |
| 10 | Wholesale trade | 1.7 | 2.8 | 1.7 | 3.9 | 0.8 | 2.6 |
| 11 | Retail trade | 1.4 | 6.2 | 7.9 | 1.2 | 7.6 | −1.0 |
| 12 | Transportation and warehousing | 4.0 | 4.1 | 3.7 | −0.2 | 6.4 | −0.2 |
| 13 | Information | 3.2 | 12.1 | 11.1 | 7.2 | 4.3 | 13.4 |
| 14 | Finance, insurance, real estate, rental, and leasing | −1.2 | −2.1 | 1.5 | −1.7 | −0.3 | 2.6 |
| 15 | Finance and insurance | −6.1 | −8.8 | 3.6 | −7.7 | −5.5 | −2.0 |
| 16 | Real estate and rental and leasing | 1.8 | 2.0 | 0.3 | 1.8 | 2.7 | 5.3 |
| 17 | Professional and business services | 4.2 | 5.8 | 4.8 | 4.4 | 3.5 | 7.8 |
| 18 | Professional, scientific, and technical services | 1.9 | 6.3 | 3.7 | 3.5 | 6.0 | 9.3 |
| 19 | Management of companies and enterprises | 7.1 | 5.7 | 10.8 | 10.5 | −1.7 | 4.8 |
| 20 | Administrative and waste management services | 7.8 | 4.8 | 3.7 | 2.7 | 0.9 | 6.0 |
| 21 | Educational services, health care, and social assistance | 0.9 | 2.5 | 1.3 | 1.9 | 4.4 | 3.9 |
| 22 | Educational services | −9.9 | −0.2 | 3.2 | 1.0 | 3.0 | −0.5 |
| 23 | Health care and social assistance | 2.8 | 2.9 | 1.0 | 2.0 | 4.6 | 4.7 |
| 24 | Arts, entertainment, recreation, accommodation, and food services | −1.0 | 4.1 | 2.7 | −0.9 | −3.3 | 6.7 |
| 25 | Arts, entertainment, and recreation | −7.4 | 10.7 | 11.8 | −3.5 | −5.1 | 9.5 |
| 26 | Accommodation and food services | 1.5 | 1.8 | −0.5 | 0.1 | −2.7 | 5.7 |
| 27 | Other services, except government | −1.7 | 2.5 | 3.3 | 1.1 | 0.0 | 4.2 |
| 28 | Government | 1.1 | −0.1 | 0.3 | 0.0 | −0.9 | 0.6 |
| 29 | Federal | 0.6 | −0.7 | 0.1 | −0.6 | −1.5 | −0.2 |
| 30 | State and local | 1.3 | 0.2 | 0.3 | 0.2 | −0.6 | 0.9 |
| Addenda: | |||||||
| 31 | Private goods-producing industries1 | 5.3 | 3.2 | 1.3 | 5.2 | 3.8 | 3.4 |
| 32 | Private services-producing industries2 | 0.8 | 3.0 | 3.3 | 1.6 | 2.0 | 4.7 |
- Consists of agriculture, forestry, fishing, and hunting; mining; construction; and manufacturing.
- Consists of utilities; wholesale trade; retail trade; transportation and warehousing; information; finance, insurance, real estate, rental, and leasing; professional and business services; educational services, health care, and social assistance; arts, entertainment, recreation, accommodation, and food services; and other services, except government.
Table 2 shows each industry’s contribution to the real GDP growth in the second quarter of 2018.
- U.S. economic growth accelerated in the second quarter of 2018, increasing 4.2 percent after increasing 2.2 percent in the first quarter. Overall, 17 out of 22 major industry groups contributed to the acceleration in economic activity.
- Mining was the leading contributor to the acceleration in real GDP growth, contributing 0.17 percentage point to GDP growth after subtracting 0.30 percentage point in the first quarter. The acceleration was driven by oil and gas extraction.
- Information was the second-largest contributor to the acceleration in real GDP growth, contributing 0.70 percentage point after contributing 0.23 percentage point. The second-quarter acceleration was driven primarily by data processing, internet publishing, and other information services.
- Utilities turned up, contributing 0.28 percentage point after subtracting 0.12 percentage point.
- Real estate and rental and leasing accelerated, contributing 0.70 percentage point after contributing 0.36 percentage point. The acceleration was driven by an upturn in other real estate.
- Nondurable goods, which turned down, was the largest offsetting industry group to GDP growth, subtracting 0.19 percentage point after contributing 0.58 percentage point. A downturn in petroleum and coal products drove this result.
- Retail trade turned down, subtracting 0.06 percentage point to GDP growth after contributing 0.41 percentage point. This was led by a deceleration in other retail and a downturn in motor vehicle and parts dealers.
| Line | 2017 | 2018 | |||||
|---|---|---|---|---|---|---|---|
| I | II | III | IV | I | II | ||
| 1 | Gross domestic product1 | 1.8 | 3.0 | 2.8 | 2.3 | 2.2 | 4.2 |
| 2 | Private industries | 1.45 | 2.66 | 2.54 | 2.02 | 2.03 | 3.89 |
| 3 | Agriculture, forestry, fishing, and hunting | −0.04 | −0.07 | −0.08 | −0.04 | −0.07 | 0.07 |
| 4 | Mining | 0.03 | 0.34 | 0.17 | −0.08 | −0.30 | 0.17 |
| 5 | Utilities | −0.17 | 0.14 | −0.10 | 0.13 | −0.12 | 0.28 |
| 6 | Construction | 0.06 | −0.11 | 0.04 | 0.26 | 0.16 | 0.11 |
| 7 | Manufacturing | 0.84 | 0.39 | 0.10 | 0.74 | 0.88 | 0.26 |
| 8 | Durable goods | 0.21 | 0.28 | 0.38 | 0.43 | 0.29 | 0.45 |
| 9 | Nondurable goods | 0.63 | 0.10 | −0.28 | 0.32 | 0.58 | −0.19 |
| 10 | Wholesale trade | 0.10 | 0.17 | 0.10 | 0.24 | 0.05 | 0.16 |
| 11 | Retail trade | 0.08 | 0.34 | 0.43 | 0.07 | 0.41 | −0.06 |
| 12 | Transportation and warehousing | 0.12 | 0.13 | 0.12 | −0.01 | 0.20 | 0.00 |
| 13 | Information | 0.17 | 0.61 | 0.57 | 0.38 | 0.23 | 0.70 |
| 14 | Finance, insurance, real estate, rental, and leasing | −0.24 | −0.43 | 0.31 | −0.36 | −0.07 | 0.55 |
| 15 | Finance and insurance | −0.48 | −0.69 | 0.27 | −0.60 | −0.43 | −0.14 |
| 16 | Real estate and rental and leasing | 0.24 | 0.27 | 0.04 | 0.24 | 0.36 | 0.70 |
| 17 | Professional and business services | 0.51 | 0.71 | 0.59 | 0.54 | 0.43 | 0.96 |
| 18 | Professional, scientific, and technical services | 0.14 | 0.46 | 0.28 | 0.26 | 0.44 | 0.68 |
| 19 | Management of companies and enterprises | 0.13 | 0.11 | 0.20 | 0.19 | −0.03 | 0.09 |
| 20 | Administrative and waste management services | 0.23 | 0.15 | 0.11 | 0.08 | 0.03 | 0.18 |
| 21 | Educational services, health care, and social assistance | 0.08 | 0.22 | 0.11 | 0.16 | 0.37 | 0.34 |
| 22 | Educational services | −0.13 | 0.00 | 0.04 | 0.01 | 0.04 | −0.01 |
| 23 | Health care and social assistance | 0.21 | 0.22 | 0.07 | 0.15 | 0.34 | 0.34 |
| 24 | Arts, entertainment, recreation, accommodation, and food services | −0.04 | 0.17 | 0.11 | −0.04 | −0.14 | 0.27 |
| 25 | Arts, entertainment, and recreation | −0.08 | 0.11 | 0.12 | −0.04 | −0.06 | 0.10 |
| 26 | Accommodation and food services | 0.04 | 0.05 | −0.01 | 0.00 | −0.08 | 0.17 |
| 27 | Other services, except government | −0.04 | 0.05 | 0.07 | 0.02 | 0.00 | 0.09 |
| 28 | Government | 0.14 | −0.01 | 0.03 | 0.00 | −0.11 | 0.07 |
| 29 | Federal | 0.02 | −0.03 | 0.00 | −0.02 | −0.06 | −0.01 |
| 30 | State and local | 0.11 | 0.01 | 0.03 | 0.02 | −0.06 | 0.08 |
| Addenda: | |||||||
| 31 | Private goods-producing industries2 | 0.89 | 0.55 | 0.23 | 0.88 | 0.67 | 0.61 |
| 32 | Private services-producing industries3 | 0.56 | 2.11 | 2.31 | 1.14 | 1.36 | 3.28 |
- GDP
- Gross domestic product
- The estimates of gross domestic product under the contributions columns are percent changes.
- Consists of agriculture, forestry, fishing, and hunting; mining; construction; and manufacturing.
- Consists of utilities; wholesale trade; retail trade; transportation and warehousing; information; finance, insurance, real estate, rental, and leasing; professional and business services; educational services, health care, and social assistance; arts, entertainment, recreation, accommodation, and food services; and other services, except government.
Note. Percentage-point contributions do not sum to the percent change in real gross domestic product because the industry details are calculated using source data and methodologies that differ from those used to calculate growth in the top-line, expenditure-based measure of real GDP.
Comprehensive updates, which occur approximately every 5 years, differ from annual updates in the scope of improvements and in the number of years subject to revision. They provide opportunities for BEA to make changes to its economic accounts to increase the overall quality, relevance, and accuracy of the accounts, while better reflecting the evolving U.S. economy.
The 2018 comprehensive update introduced three major types of improvements: (1) integration with the 2012 benchmark SUTs and the 2018 comprehensive update of the NIPAs, (2) changes in definitions and classifications, which update the accounts to more accurately portray the dynamic U.S. economy and to better facilitate comparisons with economic data available from other countries, and (3) statistical changes, which update the accounts through the use of new and improved estimation methods and newly available and revised source data, including the Economic Census, which is used to benchmark the accounts. Combined, these improvements enable the accounts to continue to accurately measure the structure of the U.S. economy. Major additions and changes that were introduced in the 2018 comprehensive update include the following:
- Incorporation of the results of the 2018 comprehensive update of the NIPAs.2
- A shift in emphasis toward SUTs consistent with international recommendations from the 2008 System of National Accounts (SNA 2008) and away from the current make-use framework.3
- Release of the new 2012 detailed benchmark SUTs.
- Release of updated 2007 detailed benchmark SUTs consistent with the full time series of annual tables as well as the new 2012 benchmark tables.4
- Updated industry and commodity definitions consistent with the 2012 North American Industry Classification System (NAICS).
- Introduction of more detailed annual data on value added, gross output, and intermediate inputs at roughly the four-digit NAICS level of detail (138 industries) as part of the underlying detail for the IEAs. Currently, the most detailed annual data are published at roughly the three-digit NAICS level (71 industries).
The benchmark SUTs
A major highlight of the 2018 comprehensive update to the IEAs is the release of the 2012 benchmark SUTs. Benchmark tables provide a detailed picture of the economy, showing relationships among hundreds of industries and commodities. Benchmark tables also serve as the statistical foundation for other BEA estimates, including GDP. More specifically, the levels and commodity distributions of final-use categories are set as part of a reconciliation process between production-based data from the SUT framework and expenditure-based data from the NIPAs.
Beginning with this update, BEA's featured set of input-output tables will be presented in the supply-use framework, as recommended in the SNA 2008. With this change, U.S. data will be presented using valuations and a presentational format more comparable to international data. Although the supply-use format will be the featured set of input-output tables, BEA will continue to publish data in the current make-use format as supplementary tables.
Changes in definition
As part of the 2018 comprehensive update, several major changes in definition will be incorporated into both the IEAs and the NIPAs, reflecting ongoing work to further integrate these two sets of statistics. These changes include the following:
- Reclassification of research and development (R&D) for software originals from own-account software (OAS) to own-account R&D
- Recognition of capital services in own-account investment in software and R&D
- Reclassification of “other” state and local personal current taxes as “other” taxes on production
In the supply table, industries that produce software investment saw a decrease in their secondary production of OAS and an offsetting increase in their production of own-account R&D, resulting in an overall increase in the domestic supply of R&D and a corresponding decrease in the domestic supply of software. For 1987–2001, the revisions for own-account software and R&D related to software originals offset one another. For 2002 forward, the revisions deviated from one another, reflecting slightly revised assumptions used in estimating own-account software. In 2012, own-account software was revised down $53.4 billion, while R&D was revised up $62.0 billion. The revisions each fall within private fixed investment (PFI), resulting in a net upward impact on total PFI and GDP.
The incorporation of capital services into own-account investment in software and R&D industries that produce these commodities resulted in an overall upward revision in production value of about $11.2 billion in 2012. Between 2012 and 2017, the revisions ranged from $11.2 to $14.4 billion. The resulting increase is absorbed in the use table by corresponding increases in nonresidential private fixed investment in intellectual property products, which resulted in upward revisions to both total PFI and GDP.
Finally, the reclassification of selected state and local payroll taxes from personal current taxes to taxes on production and imports led to offsetting $1.6 billion revisions in the use table in 2012, as this value was reassigned from gross operating surplus to other taxes on production. This change left total value added by industry unaffected.
Changes in classification
IEA statistics released as part of the 2018 comprehensive update are classified and presented on a 2012 NAICS basis; previously, the statistics were classified and presented on a 2007 NAICS basis. Overall, changes stemming from using the 2012 NAICS are small; the manufacturing, wholesale, and retail trade sectors have several changes, but none involved reclassification to another sector.5
With the release of the 2018 IEA comprehensive update, BEA published 405 industries in the 2012 benchmark SUTs, compared with 388 industries in the 2007 benchmark SUTs. Wholesale and retail trade were among the largest expansions. To provide a more detailed assignment of trade margins within the supply-use framework, secondary production of retail and wholesale commodities was broken-out to reflect the specific type of retail or wholesale commodity. This reallocation represents a significant improvement in the specificity and granularity of the trade margin data. For wholesale trade, BEA published 11 industries in 2012; in 2007, BEA only published a total wholesale trade aggregate. For retail trade, BEA published 9 industries in 2012, compared with 4 industries in 2007 (table 3).
| 2007 BEA codes | Previous publication level |
2012 BEA codes | New publication level |
|---|---|---|---|
| HS | Real estate | HSO | Owner-occupied housing services |
| HST | Tenant-occupied housing services | ||
| 524100 | Insurance carriers | 524113 | Direct life insurance carriers |
| 5241X | Insurance carriers, except direct life | ||
| 524200 | Insurance agencies, brokerages, and related activities | 524200 | Insurance agencies, brokerages, and related activities |
| GSLG | General state and local government services | GSLGE | State and local government educational services |
| GSLGH | State and local government hospitals and health services | ||
| GSLGO | State and local government other services | ||
| 420000 | Wholesale trade | 423100 | Motor vehicle and motor vehicle parts and supplies |
| 423400 | Professional and commercial equipment and supplies | ||
| 423600 | Household appliances and electrical and electronic goods | ||
| 423800 | Machinery, equipment, and supplies | ||
| 423A00 | Other durable goods merchant wholesalers | ||
| 424200 | Drugs and druggists’ sundries | ||
| 424400 | Grocery and related product wholesalers | ||
| 424700 | Petroleum and petroleum products | ||
| 424A00 | Other nondurable goods merchant wholesalers | ||
| 425000 | Wholesale electronic markets and agents and brokers | ||
| 4200ID | Customs duties | ||
| 4A0000 | Other retail | 444000 | Building material and garden equipment and supplies dealers |
| 446000 | Health and personal care stores | ||
| 447000 | Gasoline stations | ||
| 448000 | Clothing and clothing accessories stores | ||
| 454000 | Nonstore retailers | ||
| 4B0000 | All other retail |
Statistical improvements
Statistical improvements are changes in estimation procedures to incorporate new and improved methods as well as newly available and revised source data. Several notable improvements in statistical methods were introduced with the release of the 2018 comprehensive update. These improvements include the following:
- Reclassification of taxes
- Introduction of new digital media product lines to the information sector
The updates in taxes improved the distinction between “taxes on products” (TOP) and “other taxes on production” (OTOP), which is more consistent with the recommendations of the SNA 2008 and enhances the compatibility of the NIPA measures of taxes on production and imports with the measures in the industry accounts. The changes had no aggregate effect on the estimates, as they represent reassignment of value rather than the introduction of new value to the SUTs. However, the updated distribution of taxes across different categories significantly enhances the accuracy of TOPs by commodity and OTOPs by industry.
The incorporation of new digital media products to information sector output estimates reflects new 2012 Economic Census revenue data that captures downloads of electronic media for permanent ownership. In addition, the accounts now capture retail trade sales statistics for “video content downloads,” the retail trade industry's secondary production of digital downloads. Although this new output represents a small upward revision (less than $1 billion) in 2012, BEA expects digital media content to show significant growth moving forward. With the rising importance of the digital economy, incorporating this improvement is a key step toward capturing this dynamic and rapidly changing sector of the economy with improved accuracy.6
Source data
The primary data source for the benchmark SUTs is the Economic Census, which the Census Bureau conducts every 5 years. The Economic Census is the preferred data source because it provides the most comprehensive data available in terms of industry coverage and captures activity in the relevant economic units for those industries. The Economic Census collects data at the level of the smallest operating unit, the “establishment,” and provides most of the essential data required for the tables, including inventories, receipts and expenses of business establishments and of government, sales by detailed industry and product line, final industry and product shipments, input costs by general category, and trade margins.
For 2014 through 2017, the updated estimates reflect the incorporation of newly available and revised source data, which are regularly included in the annual updates, and which became available after the annual update in November of 2017. These data include the following:
- Annual Survey of State and Local Governments for fiscal year 2015 (revised) and 2016 (new)
- Annual Survey of Manufactures for 2015 (revised) and 2016 (new)
- Annual Survey of Wholesale Trade for 2015 (revised) and 2016 (new)
- Annual Retail Trade Survey for 2015 (revised) and 2016 (new)
- Service Annual Survey for 2016 (revised) and 2017 (new)
- Value of Construction Put in Place Survey for 2015 and 2016 (revised) and 2017 (preliminary)
- Office of Management and Budget federal government budget data for fiscal Year 2017 (revised) and 2018 (new)
- BEA data for 2015–2017 (revised) from the International Transactions Accounts
- Bureau of Labor Statistics (BLS) Quarterly Census of Employment and Wages for 2014–2016 (revised)
- Internal Revenue Service (IRS) tabulations of corporate tax returns for 2015 (revised) and for 2016 (new)
- IRS tabulations of sole proprietorship and partnership tax returns for 2016 (new)
- U.S. Department of Agriculture farm statistics for 2015–2017 (revised)
Principal sources of data used to construct current-dollar and chained-dollar estimates for benchmark and nonbenchmark years can be found in table A and table B at the end of this article. Principal sources of data used to construct the quarterly estimates can be found in table C, also at the end of this article.
Gross output
Starting in 2010, data from the Census Bureau Service Annual Survey (SAS) replaced Bureau of Transportation Statistics (BTS) data as the annual indicator for the air transportation industry. The SAS data provided break-outs of domestic and international freight and passenger transportation that assisted in the construction of improved supply-use tables. The Economic Census was used to establish the 2007 and 2012 pillar estimates for the time series, and the 2007 level was backcast to 1997 using data from BTS. BTS data was also used as the source indicator up to 2010, when it was replaced with SAS data to complete the time series.
For IEA quarterly statistics, the Census Bureau Quarterly Services Survey (QSS) data are used as output indictors in place of existing NIPA personal consumption expenditures (PCE) estimates for educational services and accommodation services. NIPA PCE indicators capture personal consumption and do not include business intermediate purchases, while the QSS data captures both. Output estimates for the educational services industry and the accommodation services industry were improved by the replacement because the QSS data more accurately reflect activities that are conceptually included in those industries.
Prices
BEA continually strives to improve the price indexes used throughout the industry accounts and consults regularly with colleagues at BEA, BLS, and the Federal Reserve Board. BEA has introduced several improved indexes and extended improvements introduced in prior updates.
Software, medical equipment, and communications equipment. Software, medical equipment, and communications equipment typically experience rapid innovation and are associated with state-of-the-art technologies. Such products present challenges when using standard matched-model techniques to construct quality-adjusted price indexes. As part of the 2018 comprehensive update, BEA introduced several improved indexes and extended improvements that were introduced in prior updates to previous years to improve the deflation of output measures of software, medical equipment, and communications equipment.7
Amusement, gambling, and recreation. Three new BLS producer price indexes became available within “amusement, gambling, and recreation” and were incorporated into the annual and quarterly time series, replacing more aggregated PCE deflators from the NIPAs.
Motion picture and sound recording. Intermediate business purchases of licensing make up a substantial portion of motion picture and sound recording output. A BLS producer price index was incorporated to improve deflation of this output, replacing more aggregated PCE deflators from the NIPAs that largely capture personal consumption.
The percent change in real GDP growth for the first quarter of 2018 was revised up 0.2 percentage point to 2.2 percent from the previously published 2.0 percent (table 4). This revision reflected an upward revision to the production of private industries (both goods and services). The direction of growth in real value added was revised for 5 of 22 major industry groups.
- Nondurable-goods manufacturing was revised up 8.4 percentage points, driving the upward revision within private goods-producing industries; value-added growth in this industry group was revised up to 12.1 percent from 3.8 percent.
- Professional, scientific, and technical services was the second leading driver of the upward revision to real value added and the primary driver of the upward revision within private services-producing industries. Value-added growth in this industry group was revised up 4.2 percentage points to 6.0 percent from 1.8 percent.
- The upward revision to real GDP growth was offset by a downward revision of 7.8 percentage points to finance and insurance, which was revised down to −5.5 percent from 2.2 percent.
| Line | 1997–2002 (Average) | 2002–2007 (Average) | 2007–2012 (Average) | |||||||
|---|---|---|---|---|---|---|---|---|---|---|
| Updated Statistics | Previous Statistics | Revision | Updated Statistics | Previous Statistics | Revision | Updated Statistics | Previous Statistics | Revision | ||
| 1 | Gross domestic product | 3.2 | 3.2 | 0.0 | 2.8 | 2.7 | 0.1 | 1.0 | 0.8 | 0.1 |
| 2 | Private industries | 3.4 | 3.4 | 0.0 | 2.9 | 2.8 | 0.2 | 0.8 | 0.7 | 0.2 |
| 3 | Agriculture, forestry, fishing, and hunting | 3.1 | 3.0 | 0.1 | 2.3 | 2.5 | −0.2 | −1.5 | −0.8 | −0.7 |
| 4 | Mining | 1.6 | 0.9 | 0.7 | 2.8 | 0.6 | 2.2 | 3.9 | 5.4 | −1.6 |
| 5 | Utilities | −0.1 | 0.2 | −0.3 | 1.7 | 0.7 | 1.0 | 3.2 | 0.9 | 2.3 |
| 6 | Construction | 1.5 | 1.3 | 0.2 | −0.5 | −0.7 | 0.2 | −5.2 | −4.4 | −0.8 |
| 7 | Manufacturing | 2.7 | 2.7 | 0.0 | 4.3 | 3.8 | 0.4 | −0.5 | −0.2 | −0.2 |
| 8 | Durable goods | 4.5 | 4.4 | 0.1 | 6.0 | 5.5 | 0.5 | 2.2 | 1.6 | 0.6 |
| 9 | Nondurable goods | 0.2 | 0.3 | −0.1 | 2.1 | 1.8 | 0.3 | −3.3 | −2.0 | −1.3 |
| 10 | Wholesale trade | 4.2 | 4.1 | 0.1 | 3.6 | 4.0 | −0.4 | 0.4 | −0.4 | 0.8 |
| 11 | Retail trade | 4.9 | 4.5 | 0.4 | 2.0 | 2.0 | 0.0 | −1.4 | −0.8 | −0.5 |
| 12 | Transportation and warehousing | −0.9 | −0.8 | −0.2 | 3.0 | 3.6 | −0.5 | −0.1 | 0.1 | −0.2 |
| 13 | Information | 7.2 | 6.8 | 0.5 | 7.4 | 6.9 | 0.5 | 3.4 | 2.8 | 0.7 |
| 14 | Finance, insurance, real estate, rental, and leasing | 4.4 | 4.9 | −0.4 | 2.5 | 2.5 | 0.0 | 1.8 | 1.5 | 0.3 |
| 15 | Finance and insurance | 7.0 | 8.3 | −1.4 | 1.8 | 1.9 | −0.1 | 1.3 | 1.1 | 0.3 |
| 16 | Real estate and rental and leasing | 3.0 | 2.9 | 0.1 | 2.9 | 2.9 | 0.0 | 2.3 | 2.0 | 0.3 |
| 17 | Professional and business services | 3.8 | 3.7 | 0.1 | 2.9 | 2.7 | 0.2 | 2.4 | 2.0 | 0.4 |
| 18 | Professional, scientific, and technical services | 4.4 | 4.1 | 0.3 | 3.1 | 2.8 | 0.3 | 2.9 | 2.1 | 0.8 |
| 19 | Management of companies and enterprises | 2.3 | 2.3 | 0.0 | −1.0 | −0.5 | −0.5 | 1.6 | 1.3 | 0.3 |
| 20 | Administrative and waste management services | 3.6 | 3.8 | −0.3 | 4.8 | 4.7 | 0.1 | 1.9 | 2.2 | −0.3 |
| 21 | Educational services, health care, and social assistance | 2.8 | 2.5 | 0.2 | 3.2 | 3.0 | 0.3 | 2.5 | 2.1 | 0.4 |
| 22 | Educational services | 2.1 | 1.9 | 0.1 | 2.3 | 2.5 | −0.3 | 3.3 | 2.3 | 1.0 |
| 23 | Health care and social assistance | 2.9 | 2.6 | 0.3 | 3.4 | 3.1 | 0.3 | 2.4 | 2.1 | 0.4 |
| 24 | Arts, entertainment, recreation, accommodation, and food services | 2.7 | 2.6 | 0.1 | 2.1 | 2.2 | −0.1 | 0.2 | 0.2 | 0.0 |
| 25 | Arts, entertainment, and recreation | 1.5 | 1.4 | 0.1 | 2.6 | 2.9 | −0.3 | 2.3 | 1.3 | 1.0 |
| 26 | Accommo- dation and food services |
3.1 | 3.0 | 0.1 | 1.9 | 1.9 | −0.1 | −0.5 | −0.2 | −0.4 |
| 27 | Other services, except government | 0.0 | −0.1 | 0.0 | 0.0 | −0.1 | 0.1 | −2.2 | −1.9 | −0.3 |
| 28 | Government | 1.4 | 1.4 | 0.0 | 1.1 | 1.1 | 0.0 | 0.4 | 0.6 | −0.2 |
| 29 | Federal | 0.2 | 0.2 | 0.0 | 1.3 | 1.3 | −0.1 | 1.4 | 1.5 | −0.1 |
| 30 | State and local | 2.1 | 2.0 | 0.0 | 1.0 | 1.0 | 0.0 | −0.1 | 0.2 | −0.2 |
| Addenda: | ||||||||||
| 31 | Private goods-producing industries1 | 2.4 | 2.3 | 0.1 | 3.0 | 2.5 | 0.5 | −1.2 | −0.6 | −0.5 |
| 32 | Private services-producing industries2 | 3.7 | 3.7 | 0.0 | 2.9 | 2.9 | 0.1 | 1.4 | 1.0 | 0.3 |
| 33 | Information-communications-technology-producing industries3 | 12.9 | 12.9 | 0.0 | 11.2 | 11.0 | 0.2 | 6.7 | 4.5 | 2.2 |
- Consists of agriculture, forestry, fishing, and hunting; mining; construction; and manufacturing.
- Consists of utilities; wholesale trade; retail trade; transportation and warehousing; information; finance, insurance, real estate, rental, and leasing; professional and business services; educational services, health care, and social assistance; arts, entertainment, recreation, accommodation, and food services; and other services, except government.
- Consists of computer and electronic product manufacturing (excluding navigational, measuring, electromedical, and control instruments manufacturing); software publishers; broadcasting and telecommunications; data processing, hosting and related services; Internet publishing and broadcasting and Web search portals; and computer systems design and related services.
| Line | 2013 | 2014 | 2015 | |||||||
|---|---|---|---|---|---|---|---|---|---|---|
| Updated Statistics | Previous Statistics | Revision | Updated Statistics | Previous Statistics | Revision | Updated Statistics | Previous Statistics | Revision | ||
| 1 | Gross domestic product | 1.8 | 1.7 | 0.1 | 2.5 | 2.6 | −0.1 | 2.9 | 2.9 | 0.0 |
| 2 | Private industries | 1.9 | 1.8 | 0.1 | 2.7 | 2.8 | −0.1 | 3.1 | 3.1 | 0.1 |
| 3 | Agriculture, forestry, fishing, and hunting | 16.6 | 17.0 | −0.4 | 0.5 | −0.8 | 1.3 | 6.7 | 7.6 | −0.9 |
| 4 | Mining | 3.9 | 6.7 | −2.8 | 9.9 | 8.9 | 1.1 | 8.4 | 5.8 | 2.6 |
| 5 | Utilities | −1.1 | −0.8 | −0.2 | −4.2 | −3.1 | −1.1 | −0.6 | −1.4 | 0.8 |
| 6 | Construction | 2.5 | 2.8 | −0.3 | 1.3 | 1.8 | −0.5 | 4.2 | 5.3 | −1.1 |
| 7 | Manufacturing | 3.1 | 2.0 | 1.1 | 1.0 | 1.5 | −0.5 | 0.5 | 0.9 | −0.4 |
| 8 | Durable goods | 2.5 | 1.2 | 1.2 | 0.8 | 1.5 | −0.7 | 1.3 | 0.2 | 1.1 |
| 9 | Nondurable goods | 3.8 | 2.8 | 1.0 | 1.2 | 1.6 | −0.4 | −0.4 | 1.7 | −2.1 |
| 10 | Wholesale trade | 2.3 | 3.2 | −0.9 | 4.0 | 4.5 | −0.5 | 4.0 | 2.9 | 1.2 |
| 11 | Retail trade | 3.1 | 2.9 | 0.2 | 1.5 | 2.6 | −1.1 | 3.3 | 3.7 | −0.4 |
| 12 | Transportation and warehousing | 1.5 | 1.1 | 0.3 | 2.7 | 2.0 | 0.7 | 2.5 | 0.2 | 2.3 |
| 13 | Information | 9.1 | 6.5 | 2.6 | 2.1 | 0.2 | 1.9 | 11.3 | 10.3 | 1.0 |
| 14 | Finance, insurance, real estate, rental, and leasing | −0.9 | −0.7 | −0.2 | 3.0 | 3.0 | 0.0 | 2.3 | 2.9 | −0.5 |
| 15 | Finance and insurance | −5.9 | −4.5 | −1.4 | 5.1 | 4.1 | 1.0 | 2.8 | 4.7 | −1.9 |
| 16 | Real estate and rental and leasing | 1.9 | 1.5 | 0.5 | 1.9 | 2.5 | −0.6 | 2.1 | 1.9 | 0.2 |
| 17 | Professional and business services | 1.3 | 1.3 | 0.0 | 4.4 | 4.6 | −0.1 | 3.1 | 3.1 | 0.0 |
| 18 | Professional, scientific, and technical services | 0.3 | 0.1 | 0.2 | 4.2 | 4.3 | −0.1 | 3.8 | 3.9 | −0.1 |
| 19 | Management of companies and enterprises | 4.9 | 5.3 | −0.3 | 6.5 | 7.4 | −0.9 | 1.7 | 2.9 | −1.3 |
| 20 | Administrative and waste management services | 1.5 | 1.6 | 0.0 | 3.7 | 3.5 | 0.2 | 2.2 | 1.2 | 1.0 |
| 21 | Educational services, health care, and social assistance | 1.3 | 1.3 | 0.0 | 1.8 | 1.7 | 0.1 | 3.2 | 3.2 | 0.0 |
| 22 | Educational services | −1.6 | −2.1 | 0.5 | 1.2 | 0.4 | 0.8 | 1.0 | 0.5 | 0.5 |
| 23 | Health care and social assistance | 1.8 | 1.8 | 0.0 | 1.9 | 1.9 | 0.0 | 3.6 | 3.6 | 0.0 |
| 24 | Arts, entertainment, recreation, accommodation, and food services | 2.1 | 2.4 | −0.3 | 3.2 | 3.7 | −0.5 | 2.2 | 1.7 | 0.6 |
| 25 | Arts, entertainment, and recreation | 2.0 | 3.0 | −1.0 | 4.2 | 4.4 | −0.2 | −2.0 | −1.5 | −0.6 |
| 26 | Accommodation and food services | 2.2 | 2.2 | 0.0 | 2.8 | 3.4 | −0.6 | 3.8 | 2.8 | 1.0 |
| 27 | Other services, except government | −0.7 | −0.8 | 0.0 | 2.7 | 2.8 | 0.0 | 0.8 | 0.8 | 0.0 |
| 28 | Government | −0.7 | −0.8 | 0.1 | −0.2 | −0.2 | −0.1 | 0.0 | 0.2 | −0.2 |
| 29 | Federal | −2.3 | −2.4 | 0.1 | −0.6 | −0.9 | 0.3 | 0.1 | 0.0 | 0.1 |
| 30 | State and local | 0.1 | 0.0 | 0.1 | −0.1 | 0.2 | −0.3 | 0.0 | 0.4 | −0.4 |
| Addenda: | ||||||||||
| 31 | Private goods-producing industries1 | 3.9 | 3.6 | 0.2 | 2.1 | 2.4 | −0.3 | 2.4 | 2.8 | −0.3 |
| 32 | Private services-producing industries2 | 1.3 | 1.3 | 0.0 | 2.8 | 2.9 | −0.1 | 3.3 | 3.2 | 0.2 |
| 33 | Information-communications-technology-producing industries3 | 8.3 | 7.0 | 1.3 | 4.3 | 2.8 | 1.5 | 12.9 | 9.0 | 3.9 |
- Consists of agriculture, forestry, fishing, and hunting; mining; construction; and manufacturing.
- Consists of utilities; wholesale trade; retail trade; transportation and warehousing; information; finance, insurance, real estate, rental, and leasing; professional and business services; educational services, health care, and social assistance; arts, entertainment, recreation, accommodation, and food services; and other services, except government.
- Consists of computer and electronic product manufacturing (excluding navigational, measuring, electromedical, and control instruments manufacturing); software publishers; broadcasting and telecommunications; data processing, hosting and related services; Internet publishing and broadcasting and Web search portals; and computer systems design and related services.
| Line | 2016 | 2017 | 2018:I | |||||||
|---|---|---|---|---|---|---|---|---|---|---|
| Updated Statistics | Previous Statistics | Revision | Updated Statistics | Previous Statistics | Revision | Updated Statistics | Previous Statistics | Revision | ||
| 1 | Gross domestic product | 1.6 | 1.5 | 0.1 | 2.2 | 2.3 | −0.1 | 2.2 | 2.0 | 0.2 |
| 2 | Private industries | 1.6 | 1.5 | 0.1 | 2.1 | 2.4 | −0.2 | 2.3 | 2.2 | 0.1 |
| 3 | Agriculture, forestry, fishing, and hunting | 4.3 | 10.5 | −6.2 | −4.8 | −9.4 | 4.6 | −8.2 | −4.6 | −3.6 |
| 4 | Mining | −4.8 | −13.3 | 8.5 | 1.5 | 8.5 | −7.1 | −18.0 | 5.5 | −23.5 |
| 5 | Utilities | 5.0 | 4.7 | 0.3 | −1.0 | 1.8 | −2.8 | −7.2 | −6.4 | −0.8 |
| 6 | Construction | 3.4 | 3.3 | 0.0 | 0.8 | 0.7 | 0.1 | 4.0 | 3.9 | 0.1 |
| 7 | Manufacturing | −1.2 | 0.5 | −1.7 | 2.4 | 1.9 | 0.6 | 7.9 | 3.4 | 4.5 |
| 8 | Durable goods | −0.5 | −0.2 | −0.3 | 3.2 | 3.4 | −0.3 | 4.7 | 3.2 | 1.5 |
| 9 | Nondurable goods | −2.1 | 1.2 | −3.3 | 1.5 | 0.1 | 1.4 | 12.1 | 3.8 | 8.3 |
| 10 | Wholesale trade | −1.1 | 0.2 | −1.3 | 2.1 | 2.8 | −0.6 | 0.8 | 0.2 | 0.6 |
| 11 | Retail trade | 3.8 | 4.2 | −0.3 | 4.0 | 3.5 | 0.5 | 7.6 | 2.9 | 4.7 |
| 12 | Transportation and warehousing | 1.2 | 0.7 | 0.5 | 4.0 | 3.2 | 0.8 | 6.4 | 6.4 | 0.0 |
| 13 | Information | 10.5 | 5.5 | 5.1 | 7.1 | 4.0 | 3.1 | 4.3 | 6.8 | −2.5 |
| 14 | Finance, insurance, real estate, rental, and leasing | 1.1 | 0.7 | 0.4 | 0.1 | 1.5 | −1.4 | −0.3 | 2.9 | −3.2 |
| 15 | Finance and insurance | 0.1 | −2.1 | 2.2 | −1.6 | 1.0 | −2.6 | −5.5 | 2.2 | −7.7 |
| 16 | Real estate and rental and leasing | 1.7 | 2.4 | −0.7 | 1.0 | 1.8 | −0.7 | 2.7 | 3.3 | −0.6 |
| 17 | Professional and business services | 1.8 | 2.2 | −0.4 | 4.2 | 3.4 | 0.8 | 3.5 | 1.0 | 2.5 |
| 18 | Professional, scientific, and technical services | 2.3 | 2.9 | −0.5 | 3.4 | 2.5 | 0.9 | 6.0 | 1.8 | 4.2 |
| 19 | Management of companies and enterprises | 1.0 | 1.7 | −0.7 | 6.5 | 4.6 | 1.9 | −1.7 | 0.8 | −2.5 |
| 20 | Administrative and waste management services | 1.1 | 1.1 | 0.1 | 4.8 | 4.9 | −0.1 | 0.9 | −0.9 | 1.8 |
| 21 | Educational services, health care, and social assistance | 2.4 | 2.1 | 0.3 | 1.7 | 2.6 | −0.9 | 4.4 | 2.2 | 2.2 |
| 22 | Educational services | 1.3 | 0.3 | 1.0 | −2.1 | 0.3 | −2.4 | 3.0 | 2.8 | 0.2 |
| 23 | Health care and social assistance | 2.6 | 2.4 | 0.3 | 2.3 | 3.0 | −0.6 | 4.6 | 2.2 | 2.4 |
| 24 | Arts, entertainment, recreation, accommodation, and food services | 0.6 | 1.5 | −1.0 | 1.8 | 2.3 | −0.5 | −3.3 | −2.7 | −0.6 |
| 25 | Arts, entertainment, and recreation | 2.2 | 2.7 | −0.5 | 3.6 | 3.8 | −0.2 | −5.1 | −7.1 | 2.0 |
| 26 | Accommodation and food services | 0.0 | 1.1 | −1.1 | 1.2 | 1.8 | −0.6 | −2.7 | −1.2 | −1.5 |
| 27 | Other services, except government | −0.7 | 0.8 | −1.4 | 0.5 | 1.9 | −1.4 | 0.0 | −4.4 | 4.4 |
| 28 | Government | 1.0 | 1.0 | 0.0 | 0.7 | 0.6 | 0.2 | −0.9 | −0.5 | −0.4 |
| 29 | Federal | 0.8 | 0.6 | 0.2 | 0.3 | −0.1 | 0.3 | −1.5 | −1.6 | 0.1 |
| 30 | State and local | 1.1 | 1.2 | −0.1 | 0.9 | 0.8 | 0.1 | −0.6 | −0.1 | −0.5 |
| Addenda: | ||||||||||
| 31 | Private goods-producing industries1 | −0.2 | 0.3 | −0.5 | 1.6 | 1.6 | 0.0 | 3.8 | 3.4 | 0.4 |
| 32 | Private services-producing industries2 | 2.1 | 1.9 | 0.2 | 2.3 | 2.6 | −0.3 | 2.0 | 1.9 | 0.1 |
| 33 | Information-communications-technology-producing industries3 | 12.4 | 6.6 | 5.8 | 7.6 | .... | .... | .... | .... | .... |
- Consists of agriculture, forestry, fishing, and hunting; mining; construction; and manufacturing.
- Consists of utilities; wholesale trade; retail trade; transportation and warehousing; information; finance, insurance, real estate, rental, and leasing; professional and business services; educational services, health care, and social assistance; arts, entertainment, recreation, accommodation, and food services; and other services, except government.
- Consists of computer and electronic product manufacturing (excluding navigational, measuring, electromedical, and control instruments manufacturing); software publishers; broadcasting and telecommunications; data processing, hosting and related services; Internet publishing and broadcasting and Web search portals; and computer systems design and related services.
Quarterly statistics for 2005–2017 were benchmarked to the corresponding annual estimates, and revisions to these quarters typically follow the revisions to the annual data. Updated quarterly source data and revised seasonal factors are also incorporated in the revisions to the quarterly estimates.
2017
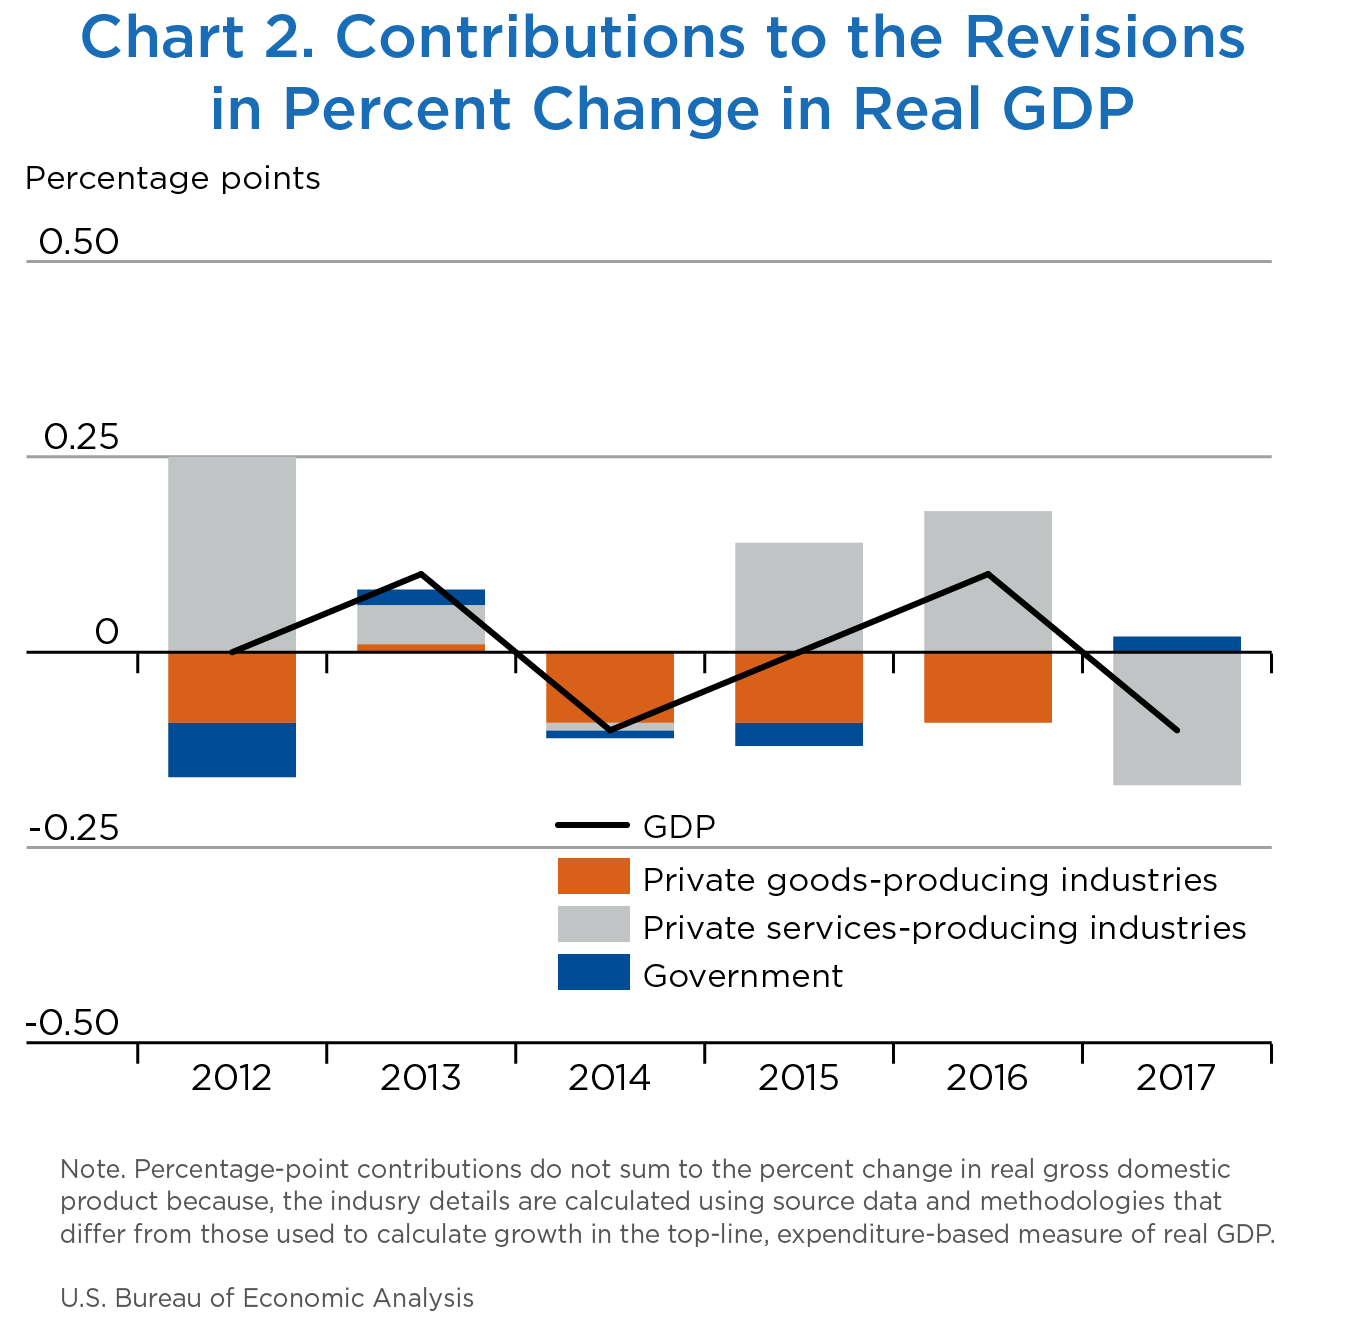
Real GDP growth was revised down 0.1 percentage point in 2017 to 2.2 percent from the previously published 2.3 percent. Value-added growth in private services-producing industries was revised downward to 2.4 percent from 2.6 percent. Growth in private goods-producing industries was revised down 0.4 percentage point to 1.2 percent. The direction of growth was unrevised for 17 of 22 major industry groups (chart 2).
- Finance and insurance was the leading contributor to the downward revision to private services-producing industries. Value-added growth in this industry was revised down to 0.4 percent from 1.5 percent, reflecting downward revisions to Federal Reserve banks, credit intermediation, and related activities and to insurance carriers and related activities.
- Mining drove the downward revision to private goods-producing industries. Growth in this industry was revised down 16.4 percentage points to a decrease of 7.9 percent from the previously published increase of 8.5 percent, led by a downward revision to oil and gas extraction.
- Growth in information was revised to 6.4 percent from 4.0 percent, partially offsetting the downward revision to real GDP growth. All four industries within information were revised upward, most significantly data processing, internet publishing, and other information services.
[Click chart to expand]
2016
Real GDP growth was revised up 0.1 percentage point in 2016 to 1.6 percent from the previously published 1.5 percent. Value-added growth in private services-producing industries was revised up to 2.3 percent from 1.9 percent. Growth in private goods-producing industries was revised down 1.3 percentage points from 0.3 percent to −1.0 percent. The direction of growth was revised for 5 of 22 major industry groups.
- Information was the leading contributor to the upward revision to private services-producing industries. Value-added growth in this industry was revised up to 13.4 percent from 5.5 percent, primarily reflecting an upward revision to data processing, internet publishing, and other information services.
- Nondurable-goods manufacturing drove the downward revision to private goods-producing industries. Growth in this industry was revised down 3.2 percentage points to a decrease of 2.0 percent from the previously published increase of 1.2 percent, reflecting a downward revision in petroleum and coal products growth.
- Wholesale trade growth was revised downward to −1.5 percent from 0.2 percent, partially offsetting the upward revision to real GDP growth and growth in private services.
2015
Real GDP growth was unrevised in 2015 at 2.9 percent. Value-added growth in private services-producing industries also went unrevised. Private goods-producing industries growth was revised up 0.1 percentage point from 2.8 percent to 2.9 percent. Government was revised downward from 0.2 percent to flat growth. The direction of growth was unchanged for 19 of 22 major industry groups.
- Mining drove the upward revision to private goods-producing industries. Growth in this industry was revised up 11.8 percentage points to 17.5 percent from the previously published increase of 5.8 percent, driven by an upward revision to growth of oil and gas extraction.
- State and local government growth was revised downward 0.4 percentage point, changing the previously published growth rate of 0.4 percent to a slight decline of −0.1 percent. This revision drove the downward revision in the government sector growth.
2014
Real GDP growth was revised down 0.1 percentage point in 2014 to 2.5 percent from the previously published 2.6 percent. Private services-producing industries, which led the growth in real GDP with growth of 2.7 percent, was revised down from 2.8 percent. Growth in private goods-producing industries was revised downward 0.3 percentage point from 2.4 percent to 2.1 percent. The direction of growth was unchanged for 20 of 22 major industry groups.
- Real estate and rental and leasing drove the downward revision to private services-producing industries. Value-added growth in this industry was revised down to 1.9 percent from 2.5 percent, reflecting a downward revision in growth of other real estate.
- Durable-goods manufacturing drove the downward revision to private goods-producing industries. Growth in this industry was revised down 0.7 percentage point to 0.8 percent from the previously published increase of 1.5 percent. Many durable-goods industries saw downward revisions to real value-added growth, led by fabricated metal products and motor vehicles, bodies and trailers, and parts.
- Growth in information was revised up to 2.1 percent from 0.2 percent, partially offsetting the downward revision to real GDP growth. The revision was mainly driven by data processing, internet publishing, and other information services.
2013
Real GDP growth was revised up 0.1 percentage point in 2013 to 1.8 percent from the previously published 1.7 percent. Private services-producing industries led the growth in real GDP with an unrevised growth rate of 1.3 percent. Growth in private goods-producing industries was revised up 0.2 percentage point to 3.9 percent. The direction of growth was unchanged for 21 of 22 major industry groups.
- Durable-goods manufacturing was the leading contributor to the upward revision to private goods-producing industries. Growth in this industry was revised up 1.3 percentage points to 2.5 percent from the previously published increase of 1.2 percent, primarily reflecting an upward revision in growth to computer and electronic products.
- Mining-sector growth was revised to 3.9 percent from 6.7 percent, partially offsetting the upward revision to real GDP growth and growth in private goods, reflecting a downward revision in growth to oil and gas extraction.
2007–2012
The average annual growth rate for real GDP was revised up 0.1 percentage point, primarily reflecting an upward revision to growth in private services-producing industries.
- Average annual growth in real value added for professional, scientific, and technical services was revised up, primarily reflecting upward revisions to computer-systems design and related services and miscellaneous professional, scientific, and technical services.
2002–2007
The average annual growth rate for real GDP was revised up slightly, primarily reflecting an upward revision to growth in private goods-producing industries.
- Average annual growth in real value added for mining was revised up, reflecting upward revisions to oil and gas extraction and support activities for mining.
1997–2002
The growth in private goods-producing industries was revised up slightly, but the average annual growth rate for real GDP was unrevised.
- Statistics for 1947–1996 have not yet been updated to reflect the 2018 comprehensive update.
- For more information, see Jason W. Chute, Stephanie H. McCulla, and Shelly Smith, “Preview of the 2018 Comprehensive Update of the National Income and Product Accounts,” Survey of Current Business 98 (April 2018).
- For additional details on the supply-use framework and how it compares to BEA's current make-use tables, see Jeffrey A. Young, Thomas F. Howells III, Erich H. Strassner, and David B. Wasshausen, “Supply-Use Tables for the United States,” Survey 95 (September 2015).
- For more information, see Erich H. Strassner and David B. Wasshausen, “Preview of the 2013 Comprehensive Revision of the Industry Economic Accounts,” Survey 93 (June 2013).
- Concordances between 2007 NAICS and 2012 NAICS are available through the Census Bureau website.
- Background information on BEA's efforts related to the digital economy are available online.
- For more information, see Jason W. Chute, Stephanie H. McCulla, and Shelly Smith, “Preview of the 2018 Comprehensive Update of the National Income and Product Accounts,” Survey of Current Business 98 (April 2018).
| Industry and commodity | 2012 benchmark-year sources | Nonbenchmark-year sources | Source for price indexes |
|---|---|---|---|
| Agriculture, forestry, fishing, and hunting | |||
| Farms | Bureau of Economic Analysis (BEA) National Income and Product Accounts (NIPAs) statistics based on U.S. Department of Agriculture (USDA) Economic Research Service (ERS) data | Farm output from BEA NIPAs based on USDA ERS data | NIPA prices based on USDA price indexes received by farmers; Bureau of Labor Statistics (BLS) Producer Price Index (PPI) data |
| Forestry, fishing, and related activities | For forestry and for logging, and forestry support activities, BEA NIPA farm output; for fishing, hunting, and trapping, commercial landings data from National Oceanic and Atmospheric Administration (NOAA), U.S. Census Bureau 2012 Economic Census North American Industry Classification System (NAICS) Sector 11, and ERS data | For forestry and for logging, and forestry support activities, NIPA farm output; for fishing, hunting, and trapping, commercial landings data from NOAA, U.S. Census Bureau Manufacturers’ Shipments, Inventories, and Orders (M3) data, and ERS data | BLS PPI, NIPA Personal Consumption Expenditure (PCE) prices, USDA/National Agricultural Statistics Service unit prices |
| Mining | |||
| Oil and gas extraction | Census Bureau 2012 Economic Census, NAICS Sector 21, Mining | U.S. Energy Information Administration (EIA) data on quantities produced and prices | BLS PPI and EIA |
| Mining, except oil and gas | Census Bureau 2012 Economic Census, NAICS Sector 21, Mining | For coal mining, EIA U.S. Coal Supply and Demand in Review; for uranium, EIA Uranium Marketing Annual Report; for all other, U.S. Geological Survey (USGS) Mineral Commodity Summaries and Mineral Industry Survey | EIA, USGS, and BLS PPI |
| Support activities for mining | Census Bureau 2012 Economic Census, NAICS Sector 21, Mining | For mining exploration, trade source data on drilling costs and footage drilled; all other support activities, USGS Mineral Commodity Summaries | EIA, USGS, BLS PPI, and trade sources |
| Utilities | |||
| For electric power generation, transmission, and distribution; natural gas distribution; and water, sewage, and other systems, Census Bureau 2012 Economic Census, NAICS Sector 22 Utilities; for electric power and natural gas distribution U.S. Department of Energy EIA | For electric power generation transmission and distribution, EIA forms 861 and 861M; for natural gas distribution, EIA form 176 and Natural Gas Monthly; for water, sewage and other systems, Census Bureau Service Annual Survey (SAS) | BLS Consumer Price Index (CPI) and BLS PPI | |
| Construction | |||
| Residential | Census Bureau Value of Construction Put in Place (VIP) survey | Census Bureau VIP survey | Census Bureau price deflator for new single-family houses under construction and BEA prices for multi-family home construction |
| Nonresidential | Census Bureau VIP survey | Census Bureau VIP survey, U.S. Department of Defense (DOD) expenditures, USDA expenditures, and BLS occupational employment statistics | BLS PPI and BEA composite prices based on trade source data and on the Census Bureau price deflator for single-family houses under construction |
| Industry and commodity | 2012 benchmark-year sources | Nonbenchmark-year sources | Source for price indexes |
|---|---|---|---|
| Manufacturing | |||
| Census Bureau 2012 Economic Census, NAICS Sector 31–33, Manufacturing; Census Bureau 2012 Current Industrial Reports | Census Bureau Annual Survey of Manufactures data, M3 shipments and inventories data, nonemployer survey data, EIA production data, Federal Reserve Bank (FRB) data, and BLS PPI | BLS PPI and NIPA prices based on DOD prices paid for military equipment, and NIPA hedonic prices | |
| Wholesale trade | |||
| Census Bureau 2012 Economic Census, NAICS Sector 42, Wholesale Trade; Census Bureau 2012 Annual Wholesale Trade Survey | Census Bureau monthly wholesale trade survey data and annual wholesale trade survey data | BLS PPI and NIPA sales deflators | |
| Retail trade | |||
| Census Bureau 2012 Economic Census, NAICS Sector 44–45, Retail Trade; Census Bureau 2012 Annual Retail Trade Survey | Census Bureau monthly retail trade survey data and annual retail trade survey (ARTS) data | BLS PPI and NIPA sales deflators | |
| Transportation and warehousing | |||
| Air transportation | Census Bureau, 2012 Economic Census, NAICS Sector 48–49, Transportation and Warehousing; U.S. Department of Transportation (DOT) Bureau of Transportation Statistics (BTS) | Census Bureau SAS data; DOT BTS Air Carrier Financial Statistics (ACFS) and U.S. Air Carrier Traffic Statistics | BLS PPI |
| Rail transportation | For rail passenger, Amtrak Annual Report; for rail freight, DOT Surface Transportation Board (STB) selected earning data | For rail passenger, Amtrak Annual Report; for rail freight, DOT STB selected earning data | BLS PPI |
| Water transportation | Census Bureau, 2012 Economic Census, NAICS Sector 48–49, Transportation and Warehousing | Census Bureau SAS data | For freight, BLS PPI; for passenger, BLS CPI |
| Truck transportation | Census Bureau, 2012 Economic Census, NAICS Sector 48–49, Transportation and Warehousing | Census Bureau SAS data | BLS PPI |
| Transit and ground passenger transportation | Census Bureau, 2012 Economic Census, NAICS Sector 48–49, Transportation and Warehousing | Census Bureau SAS data | NIPA personal consumption expenditure (PCE) prices |
| Pipeline transportation | Census Bureau, 2012 Economic Census, NAICS Sector 48–49, Transportation and Warehousing | Census Bureau SAS data | BLS PPI |
| Other transportation and support activities | Census Bureau, 2012 Economic Census, NAICS Sector 48–49, Transportation and Warehousing | Census Bureau SAS data | BLS PPI and NIPA PCE prices |
| Warehousing and storage | Census Bureau, 2012 Economic Census, NAICS Sector 48–49, Transportation and Warehousing | Census Bureau SAS data | BLS PPI |
| Information | |||
| Publishing industries, except Internet (includes software) | Census Bureau, 2012 Economic Census, NAICS Sector 51, Information. | Census Bureau SAS data | BLS PPI and BEA price indexes for software |
| Motion picture and sound recording industries | Census Bureau, 2012 Economic Census, NAICS Sector 51, Information | Census Bureau SAS data | NIPA PCE prices |
| Broadcasting and telecommunications | Census Bureau, 2012 Economic Census, NAICS Sector 51, Information | Census Bureau SAS data | BLS PPI |
| Data processing, Internet publishing, and other information services | Census Bureau, 2012 Economic Census, NAICS Sector 51, Information | Census Bureau SAS data | BLS PPI and NIPA PCE prices |
| Industry and commodity | 2012 benchmark-year sources | Nonbenchmark-year sources | Source for price indexes |
|---|---|---|---|
| Finance and insurance | |||
| Federal Reserve banks, credit intermediation, and related activities | Census Bureau, 2012 Economic Census, NAICS Sector 52, Finance and Insurance; Internal Revenue Service (IRS) Statistics of Income (SOI); FRB 2012 annual report; and Federal Deposit Insurance Corporation (FDIC), 2012 Statistics on Banking | Census Bureau SAS data; FDIC commercial bank call report data; FRB data; National Credit Union Administration; and NIPA measures of financial services indirectly measured | FRB-priced services and NIPA PCE prices |
| Securities, commodity contracts, and investments | Census Bureau, 2012 Economic Census, NAICS Sector 52, Finance and Insurance; IRS SOI; and New York Stock Exchange, 2012 Annual Report | Security Exchange Commission Financial and Operational Combined Uniform Single Report data and Census Bureau SAS data | BLS PPI and NIPA PCE prices |
| Insurance carriers and related activities | AM Best Company statistics; Census Bureau 2012 Economic Census, NAICS Sector 52, Finance and Insurance; American Council of Life Insurers, Handbook; BEA NIPA statistics on medical and hospital insurance premiums | For property and casualty insurance, life insurance, and reinsurance, AM Best Company statistics and Census Bureau SAS; for medical and hospitalization insurance, private trade source data and BEA NIPA statistics on medical and hospital insurance premiums | BLS PPI and NIPA PCE prices |
| Funds, trusts, and other financial vehicles | NIPA imputed service charges for other financial institutions | NIPA imputed service charges for other financial institutions | NIPA PCE prices |
| Real estate and rental and leasing | |||
| Real estate | Census Bureau, 2012 Economic Census, NAICS Sector 53, Real estate and rental and leasing; For residential dwellings, NIPA housing data and USDA data on farm housing; for nonresidential structures, IRS tabulations of business tax returns, NIPA rental value of buildings owned by nonprofit institutions serving households, and NIPA foreign trade statistics | For residential dwellings, NIPA housing data and USDA data on farm housing; for nonresidential structures, IRS tabulations of business tax returns, NIPA rental value of buildings owned by nonprofit institutions serving households, and NIPA foreign trade statistics | For residential dwellings, NIPA PCE prices and NIPA implicit price deflators for farm rents paid; for nonresidential structures, BLS PPI; for real estate managers and agents, BLS PPI and trade source data |
| Rental and leasing services and lessors of intangible assets | Census Bureau, 2012 Economic Census, NAICS Sector 53, Real estate and rental and leasing; for royalties, IRS tabulations of business tax returns | For rental and leasing services, Census Bureau SAS data; for royalties, IRS tabulations of business tax returns | BLS PPI, BTS and construction index, mining, crude oil receipts, and trade source data |
| Professional, scientific, and technical services | |||
| Legal services | Census Bureau, 2012 Economic Census, NAICS Sector 54, Professional, Scientific, and Technical Services | Census Bureau SAS data and BLS Quarterly Census of Employment and Wages (QCEW) data | BLS PPI and NIPA PCE prices |
| Computer systems design and related services | Census Bureau, 2012 Economic Census, NAICS Sector 54, Professional, Scientific, and Technical Services | Census Bureau SAS data | BEA price indexes for software |
| Miscellaneous professional, scientific and technical services | Census Bureau, 2012 Economic Census, NAICS Sector 54, Professional, Scientific, and Technical Services | Census Bureau SAS data, NIPA PCE, BLS QCEW data, and NIPA research and development (R&D) data | BLS PPI, NIPA PCE prices, and BEA price indexes for R&D |
| Management of companies and enterprises | |||
| Census Bureau, 2012 Economic Census, NAICS Sector 55, Management of Companies and Enterprises | BLS QCEW data | BLS PPI | |
| Administrative and waste management services | |||
| Census Bureau, 2012 Economic Census, NAICS Sector 56, Administrative and Support and Waste Management and Remediation Services | Census Bureau SAS data; BLS QCEW for auxiliary industries | BLS PPI and NIPA PCE prices | |
| Industry and commodity | 2012 benchmark-year sources | Nonbenchmark-year sources | Source for price indexes |
|---|---|---|---|
| Educational services | |||
| Census Bureau, 2012 Economic Census, NAICS Sector 61, Educational Services; U.S. Department of Education, National Center for Education Statistics, 2012 Digest of Education Statistics | PCE data for education services based on data from the Department of Education and data from BLS consumer expenditure survey | NIPA PCE prices | |
| Health care and social assistance | |||
| Census Bureau, 2012 Economic Census, NAICS Sector 62, Health Care and Social Assistance | Census Bureau SAS data | BLS PPI and NIPA PCE prices | |
| Arts, entertainment, and recreation | |||
| Census Bureau, 2012 Economic Census, NAICS Sector 71, Arts, Entertainment, and Recreation | Census Bureau SAS data | NIPA PCE prices | |
| Accommodation and food services | |||
| Accommodations | Census Bureau, 2012 Economic Census, NAICS Sector 72, Accommodation and Food Services | For hotels and motels, PCE; for all other traveler accommodations and bed and breakfasts, BLS QCEW data | BLS PPI and NIPA PCE prices |
| Food services and drinking places | Census Bureau, 2012 Economic Census, NAICS Sector 72, Accommodation and Food Services | Census Bureau ARTS data | BLS PPI |
| Other services, except government | |||
| For religious, grant making, civic and other nonprofit services; personal services and dry cleaning services; and repair and maintenance: 2012 Economic Census taxable revenue & tax-exempt expenses, National Economic Accounts (NEA), PCE, NEA Wages and Salaries; for private household services, PCE | For religious, grant making, civic and other nonprofit services, personal services, and dry cleaning services, Census Bureau SAS data, PCE, and data from the National Center for Charitable Statistics; for repair and maintenance, BLS QCEW; for private household services, PCE | BLS PPI and NIPA PCE prices | |
| Industry and commodity | 2012 benchmark-year sources | Nonbenchmark-year sources | Source for price indexes |
|---|---|---|---|
| Federal | |||
| General government | Federal Budget data; Center for Medicare and Medicaid Services; BLS Current Employment Statistics | NIPA government expenditure statistics; for federal structures, DOD investment expenditures | NIPA prices based on BLS PPI and CPI; for military facilities, DOD data on employment, prices for military construction, and construction cost indexes from trade source data |
| Government enterprises | U.S. Postal Service (USPS) receipts; EIA data for electric utilities; Federal Housing Administration (FHA) data; federal government agency reports for specific federal enterprises. | USPS receipts; EIA data for electric utilities; FHA data; government agency data for specific federal enterprises | BLS PPI |
| State and local | |||
| General government | Census Bureau, 2012 Census of Governments; Census Bureau, 2012 Government Finances; Census Bureau, 2012 Public Employment | NIPA government expenditure statistics | BLS PPI and NIPA PCE prices |
| Government enterprises | Census Bureau, 2012 Census of Governments; Census Bureau, 2012 Government Finances; Census Bureau, 2012 Public Employment; Alaska Railroad Administration data for Alaskan ferries, watersports, and airports; for electric utilities, EIA data; for state and local government structures, Census Bureau VIP survey | NIPA statistics on government enterprises based on the Census Bureau annual survey of government finances; for Alaskan ferries, watersports, and airports, Alaska Railroad Administration; for electric utilities, EIA data; for state and local government structures, Census Bureau VIP survey | BLS PPI |
- ARTS
- Annual retail trade survey
- BEA
- Bureau of Economic Analysis
- BLS
- Bureau of Labor Statistics
- BTS
- Bureau of Transportation Statistics
- CPI
- Consumer Price Index
- DOD
- Department of Defense
- DOT
- Department of Transportation
- EIA
- Energy Information Administration
- ERS
- Economic Research Service
- FDIC
- Federal Deposit Insurance Corporation
- FHA
- Federal Housing Administration
- FRB
- Federal Reserve Board
- IRS
- Internal Revenue Service
- M3
- Manufacturers’ Shipments,
- Inventories, and Orders
- NAICS
- North American Industry
- Classification System
- NEA
- National Economic Accounts
- NIPAs
- National Income and Product Accounts
- NOAA
- National Oceanic and
- Atmospheric Administration
- PCE
- Personal Consumption Expenditure
- PPI
- Producer Price Index
- QCEW
- Quarterly Census of Employment and Wages
- R&D
- Research and development
- SAS
- Service Annual Survey
- SOI
- Statistics of Income
- STB
- Surface Transportation Board
- USDA
- U.S. Department of Agriculture
- USGS
- U.S. Geological Survey
- USPS
- U.S. Postal Service
- VIP
- Value of Construction Put in Place Survey
| Source data and methods used in 2012 benchmark year |
|---|
| Intermediate inputs1 |
| Agriculture, forestry, fishing, and hunting |
| Inputs to the agriculture, forestry, fishing, and hunting industries were estimated from U.S. Department of Agriculture 2012 Census of Agriculture or by extrapolating 2007 benchmark I-O estimates. |
| Mining |
| Inputs to the mining industries were estimated primarily from the 2012 Economic Census mining sector reports. Detailed expense data used to estimate intermediate inputs included accounting, auditing, and bookkeeping services; advertising and promotional expenses; communication services; legal services; purchased electricity; purchased fuels consumed; rental payments for buildings and other structures; rental payments for machinery and equipment; supplies used and minerals received; and all other operating expenses. |
| Construction |
| Inputs to the construction industries were estimated primarily from 2012 Economic Census construction data. |
| Manufacturing |
| Inputs to the manufacturing industries were estimated primarily from the 2012 Economic Census manufacturing sector reports. Detailed expense data used to estimate intermediate inputs included accounting, auditing, and bookkeeping services; advertising and promotional services; communication services; legal services; management consulting and administrative services; materials, parts, containers, packaging, etc, used; purchased computer services; purchased electricity; purchased fuels; refuse removal services; rental payments for buildings and other structures; rental payments for machinery and equipment; repair and maintenance services of buildings and/or machinery; and all other operating expenses. Inputs were also interpolated using the 2007 benchmark I-O estimates and Annual Survey of Manufactures data. |
| Wholesale trade, retail trade, and accommodation and food services |
| Inputs to the wholesale, retail trade, and accommodation and food services industries were estimated primarily from the Census Bureau 2012 Annual Wholesale Trade Survey (AWTS) and Annual Retail Survey (ARTS) quinquennial Business Expenditure Series. Detailed expense data used to estimate intermediate inputs included packaging materials and containers; data processing and other purchased computer services; communication services; repairs and maintenance to machinery and equipment; repairs and maintenance to buildings, structures, and offices; rental payments for machinery and equipment; rental payments for buildings, offices, stores; purchased electricity; purchased fuels (except motor fuels); water, sewer, refuse removal, and other utility payments; purchased transportation, shipping and warehousing services; purchased advertising and promotional services; and purchased professional and technical services. Inputs were also interpolated using the 2007 benchmark I-O estimates. |
| Services, transportation and warehousing, and utilities |
For selected census-covered industries, information from the 2012 Service Annual Survey (SAS) on operating expenses was used. Detailed expense data used to estimate intermediate inputs included materials, parts and supplies (not for resale); purchased electricity; purchased fuels (except motor fuels); rental payments for machinery, equipment and other tangible items; rental payments for buildings, structures, and land; repairs and maintenance to machinery and equipment; repairs and maintenance to buildings, structures, and offices; advertising and promotional services; printing services; data processing and other purchased computer services; communication services; water, sewer, refuse removal and other utilities; professional and technical services; and all other operating expenses. For industries not covered by census, inputs were estimated from a variety of sources, including data from the 2012 SAS on operating expenses, and data from Amtrak, Department of Transportation Surface Transportation Board, Alaska Rail, Department of Energy, and Federal Reserve Board. |
| Source data and methods used in 2012 benchmark year |
|---|
| Value added |
| Compensation of employees |
Tabulations of wages and salaries from the Bureau of Labor Statistics Quarterly Census of Employment and Wages (QCEW) program, and estimates of supplements to wages and salaries from the National Income and Product Accounts (NIPAs) were used; data were adjusted for misreporting and I-O industry definitions. For industries not covered by the QCEW, payroll data from the 2012 Economic Censuses were used; data were adjusted for misreporting and I-O industry definitions. Benefits data were based on the relationship between the Economic Census, SAS, and Business Expenses Supplement reported benefits and payroll data, applied to the 2012 QCEW wage and salary data. For the remaining industries, benefits were estimated using indirect techniques. All estimates were adjusted to balance to total compensation by industry in the NIPAs. |
| Taxes on production and imports less subsidies |
The estimates by industry were prepared in two parts: For excise and general sales taxes, the values were estimated either as part of each industry’s output or directly assigned; for other taxes, assessments and license fees, the estimates were distributed on the basis of a variety of source data, including state government tax collections statistics, the Annual Survey of Manufactures, ARTS, AWTS and SAS. For all other tax liabilities, estimates were distributed to industries using indirect techniques. Subsidies are directly assigned to specific industries based on which industry is collecting the subsidy. All estimates were adjusted to balance to total taxes on production and imports less subsidies, by industry in the NIPAs. |
| Gross operating surplus |
| For most industries, gross operating surplus reflects a quality-weighted average of a residual estimate (total industry output less total intermediate inputs, compensation of employees, and taxes on production and imports, less subsidies) and a direct-estimate based on summing up the components of gross operating surplus from the NIPAs, adjusted to an establishment basis.2 |
- ARTS
- Annual Retail Survey
- AWTS
- Annual Wholesale Trade Survey
- I-O
- Input-Output
- NIPAs
- National Income and Product Accounts
- QCEW
- Quarterly Census of Employment and Wages
- SAS
- Service Annual Survey
- Estimates for intermediate inputs were adjusted during the process of balancing commodity purchases across industries with commodity output totals.
- See Rassier, Howells III, Morgan, Empey, and Roesch, “Integrating the 2002 Benchmark Input-Output Accounts with the 2002 Annual Industry Accounts,” Survey of Current Business 87 (December): 14–22.
| Industry and commodity | Source data for current-dollar statistics | Source data for price indexes |
|---|---|---|
| Agriculture, forestry, fishing, and hunting | ||
| Farms | Farm output from the Bureau of Economic Analysis (BEA) National Income and Product Accounts (NIPAs) based on U.S. Department of Agriculture (USDA) Economic Research Services (ERS) data | NIPA prices based on USDA price indexes received by farmers |
| Forestry, fishing, and related activities | For forestry, Federal Reserve Board (FRB) industrial production index (IPI) and Bureau of Labor Statistics (BLS) Producer Price Index (PPI); for fishing, commercial fishery landings data from the National Oceanic and Atmospheric Administration | BLS PPI and USDA National Agriculture Statistics Services unit prices |
| Mining | ||
| Oil and gas extraction | FRB IPI and BLS PPI | BLS PPI |
| Mining, except oil and gas | FRB IPI and BLS PPI | BLS PPI |
| Support activities for mining | FRB IPI, BLS PPI, and NIPA fixed investment in mining exploration based on trade source data | BLS PPI and NIPA prices based on trade source data |
| Utilities | ||
| For electric power generation, transmission, and distribution, Energy Information Association (EIA) form 861M; for natural gas distribution, EIA form 857; for water, sewage, and other systems, Census Bureau Quarterly Services Survey (QSS) | BLS Consumer Price Index (CPI) and BLS PPI | |
| Construction | ||
| Residential | NIPA fixed investment in structures based primarily on Census Bureau construction spending (value-put-in-place) survey | Census Bureau price deflator for new single-family houses under construction and BEA prices for multi-family home construction |
| Nonresidential | NIPA fixed investment in structures based primarily on Census Bureau construction spending (value-put-in-place) survey | BEA composite prices based on trade source data an on data from the Bureau of Reclamation and BLS PPI |
| Industry and commodity | Source data for current-dollar statistics | Source data for price indexes |
|---|---|---|
| Manufacturing | ||
| Census Bureau manufacturers’ shipments, inventories, and other survey (M3) and NIPA electronic computer shipments; for petroleum products, EIA production data and BLS PPI | BLS PPI and NIPA price indexes based on Department of Defense (DOD) prices paid for military equipment, and NIPA hedonic prices | |
| Wholesale trade | ||
| Census Bureau monthly wholesale trade survey data | BLS PPI and NIPA sales deflators | |
| Retail trade | ||
| Census Bureau monthly retail trade survey data | BLS PPI and NIPA sales deflators | |
| Transportation and warehousing | ||
| For air transportation, NIPA personal consumption expenditures (PCE) and Census Bureau QSS data; for rail transportation, Surface Transportation Board freight earnings data; for water, truck, transit and ground passenger, pipeline transportation, and warehousing, Census Bureau QSS data | For air transportation, BLS PPI; for rail, BLS PPI for rail passenger transportation and BLS PPI for freight; water transportation, BLS PPI, BLS CPI, and trade source data; for truck transportation, BLS PPI; for transit and ground passenger transportation, NIPA PCE prices; for pipeline transportation, BLS PPI; for warehousing, BLS PPI; for other transportation and support activities, NIPA PCE prices and BLS PPI | |
| Information | ||
| Census Bureau QSS data, BLS quarterly census of employment and wages (QCEW), and box office revenues from trade source data | For publishing industries (including software), BEA prices for software and BLS PPI; for information and data processing, NIPA PCE prices and BLS PPI | |
| Finance and insurance | ||
| Federal Reserve banks, credit intermediation, and related activities | Census Bureau QSS data, Federal Deposit Insurance Corporation commercial bank call report data, FBR data, National Credit Union Administration data, and NIPA measures of financial services indirectly measured | NIPA PCE prices |
| Securities, commodity contracts, and investments | Census Bureau QSS data and Securities and Exchange Commission Financial and Operational Combined Uniform Single Reports | BLS PPI and NIPA PCE prices |
| Insurance carriers and related activities | NIPA PCE, Census Bureau QSS data, and trade source data | BLS PPI and NIPA PCE prices |
| Funds, trusts, and other financial vehicles | NIPA PCE and NIPA imputed service charges for other financial institutions | NIPA PCE prices |
| Census Bureau, 2012 Economic Census, North American Industry Classification System Sector 51, Information | Census Bureau SAS data | |
| Industry and commodity | Source data for current-dollar statistics | Source data for price indexes |
|---|---|---|
| Real estate and rental and leasing | ||
| Real estate | For residential dwellings, NIPA PCE, NIPA housing data; for nonresidential structures, NIPA government receipts, NIPA private fixed investment, NIPA brokers’ commissions, BEA foreign expenditures from the international transactions accounts, and BLS QCEW data | For residential dwellings, NIPA PCE prices and NIPA implicit price deflators for farm rents paid; for nonresidential structures, BLS PPI and NIPA implicit price deflators for nonprofit imputed rents |
| Rental and leasing services and lessors of intangible assets | For rental and leasing services, Census Bureau QSS data, NIPA royalty income, and NIPA PCE rental income | BLS PPI and NIPA prices |
| Professional, scientific, and technical services | ||
| Census Bureau QSS data, NIPA PCE data, BLS QCEW data, and NIPA R&D data | For legal services, BLS PPI and NIPA PCE prices; for computer systems design and related services, BEA price indexes for software; for miscellaneous services, BLS PPI, NIPA PCE prices, and BEA price index for R&D | |
| Management of companies and enterprises | ||
| BLS QCEW data | BLS PPI | |
| Administrative and waste management services | ||
| Census Bureau QSS data and BLS QCEW data | BLS PPI and NIPA PCE prices | |
| Educational services | ||
| Census Bureau QSS data and NIPA PCE data | NIPA PCE prices based on trade source data for input costs | |
| Health care and social assistance | ||
| Census Bureau QSS data | For ambulatory health care services, NIPA PCE prices based on BLS CIP and BLS PPI; for hospitals and nursing and residential care facilities, NIPA PCE prices based on BLS CPI and Center for Medicare and Medicaid Services; for social assistance, NIPA PCE prices based on trade source data | |
| Industry and commodity | Source data for current-dollar statistics | Source data for price indexes |
|---|---|---|
| Arts, entertainment, and recreation | ||
| Census Bureau QSS data | BLS PPI and NIPA PCE prices | |
| Accommodation and food services | ||
| Census Bureau QSS data | For accommodations, BLS PPI and NIPA PCE prices; for food services, NIPA PCE prices | |
| Other services, except government | ||
| For repair and maintenance, personal services, and grantmaking, civic, professional, and similar organizations, Census Bureau QSS data; for religious, labor, and political organizations, NIPA PCE data; for private households, NIPA compensation | BLS PPI and NIPA PCE prices | |
| Federal | ||
| General government | NIPA government expenditures statistics | NIPA prices based on BLS PPI, BLS CPI, DOD data on employment prices, BLS employment cost indexes, and construction cost indexes from trade source data |
| Government enterprises | U.S. Postal Service quarterly reports, EIA monthly data for electric utility sales and revenue data for publicly owned utilities, and NIPA PCE data for broader aggregates for other components | BLS PPI and NIPA PCE prices |
| State and local | ||
| General government | NIPA government expenditures statistics | NIPA PCE prices |
| Government enterprises | NIPA statistics on government enterprises based on the Census Bureau annual survey of government finances; for Alaskan ferries, water ports, and airports, Alaska Railroad Administration; for electric utilities EIA data; for state and local government structures, Census Bureau construction spending (value-put-in-place) survey | BLS PPI and NIPA PCE prices |
- BEA
- Bureau of Economic Analysis
- BLS
- Bureau of Labor Statistics
- CPI
- Consumer Price Index
- DOD
- Department of Defense
- EIA
- Energy Information Administration
- ERS
- Economic Research Service
- FRB
- Federal Reserve Board
- IPI
- Industrial production index
- M3
- Manufacturers’ Shipments, Inventories, and
- Orders
- NAICS
- North American Industry Classification
- System
- NIPA
- National Income and Product Accounts
- PCE
- Personal Consumption Expenditure
- PPI
- Producer Price Index
- QCEW
- Quarterly Census of Employment and
- Wages
- R&D
- Research and development
- QSS
- Quarterly Services Survey
- USDA
- United States Department of Agriculture