Corn grain yield is the final product of numerous factors that affect crop growth and development during the growing season. Corn is undoubtedly the crop that shows the largest response to technology and management. Growers make critical decisions every year regarding the inputs needed to maximize the profitability of their farm based on the potential yield gain of a given input factor. Data collected over many years and locations by the Crop Physiology Laboratory has led to the identification and ranking of seven categorical management factors that impact yield. These ‘Seven Wonders of the Corn Yield World’ provide a framework for understanding the value of different management factors as well as their potential interactions.
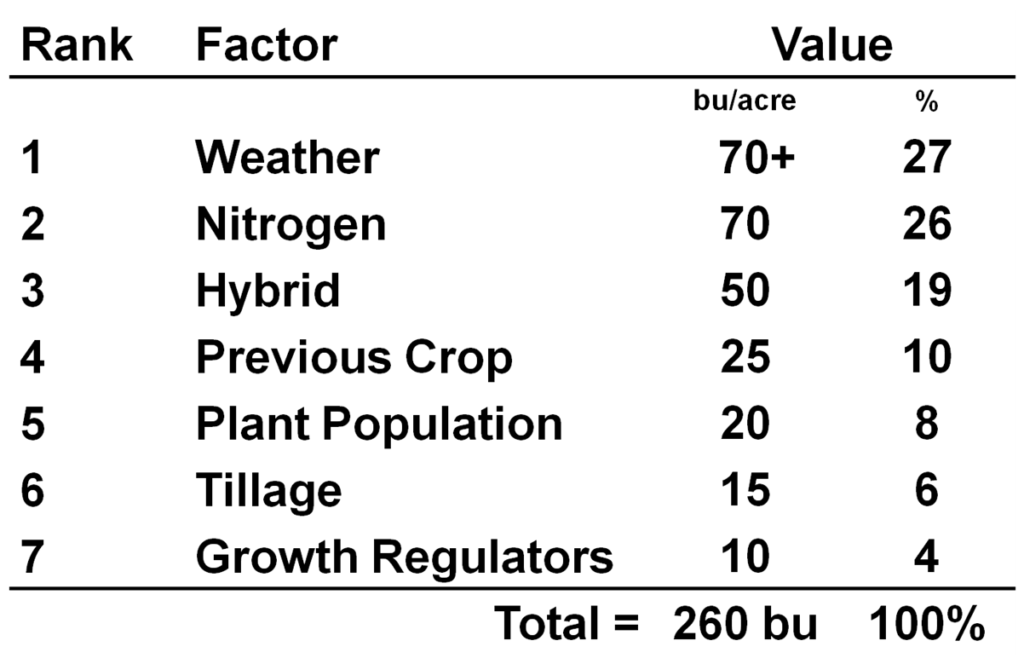
The Seven Wonders are shown in Table 1. They are ranked in order from the factor with the greatest impact on yield (Weather, #1) to the factor with the smallest contribution to yield (Growth Regulators, # 7). The values represent a range of responses based on our research. For example, the weather can influence yield by more than 70 bushels/acre.
There are two important aspects of the Seven Wonders:
- The higher a factor is on the list, the more control it exerts over the factors below it.
- The factors interact!
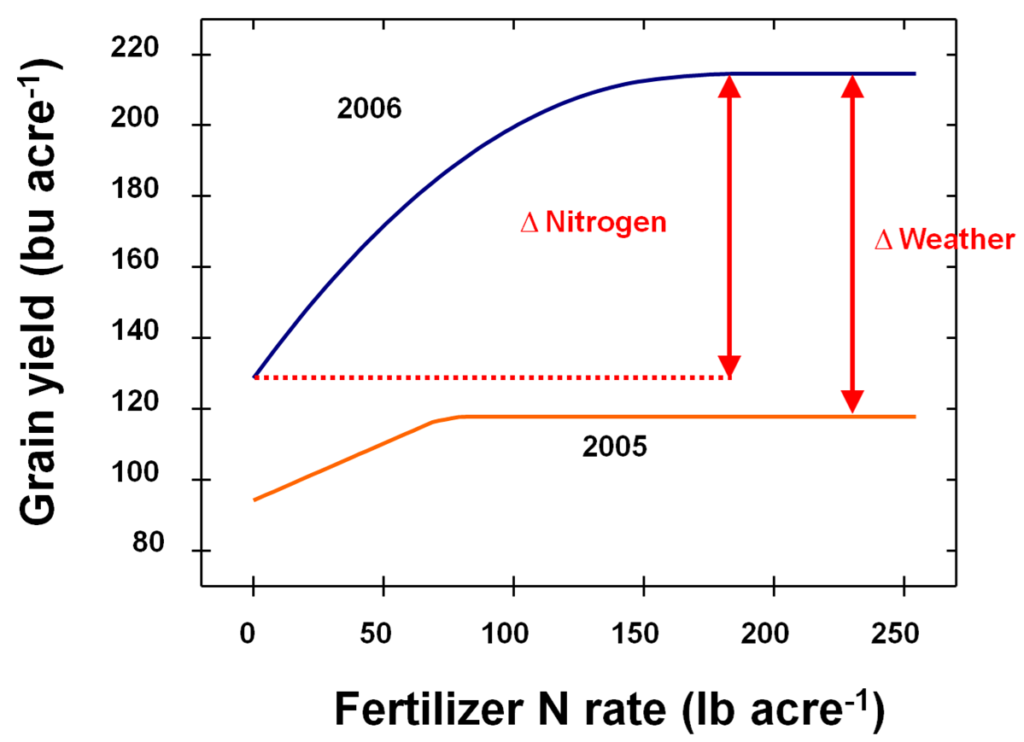
In a favorable year, weather and nitrogen combine to contribute more than 50% of total yield. On average, the maximum response to nitrogen over an unfertilized check plot treatment is approximately 70 bushels/acre (Table 1 and Figure 1). The weather, however, influences every aspect of nitrogen loss, availability, and utilization by the plant. In a drought year such as 2005, the weather limited the response to N application to approximately 20 bushels/acre (Figure 1).
The weather influences the success of all of our management efforts. Continued research and technology, however, may provide us with tools to better mitigate the detrimental impacts of drought, high temperature, and other weather-mediated stresses.
Corn hybrids can vary by as much as 50 bushels/acre when grown in the same field in our research trials (Table 1). This variation can be attributed to hybrid interactions with weather (e.g., differences in drought and heat tolerance), as well as interactions with nitrogen and plant population. The interaction of hybrid, N rate, and plant population is particularly important since these are three of the factors for which the farmer has the greatest control over. We are characterizing this interaction to better understand the management requirements of hybrids in our Management Yield Potential trial.
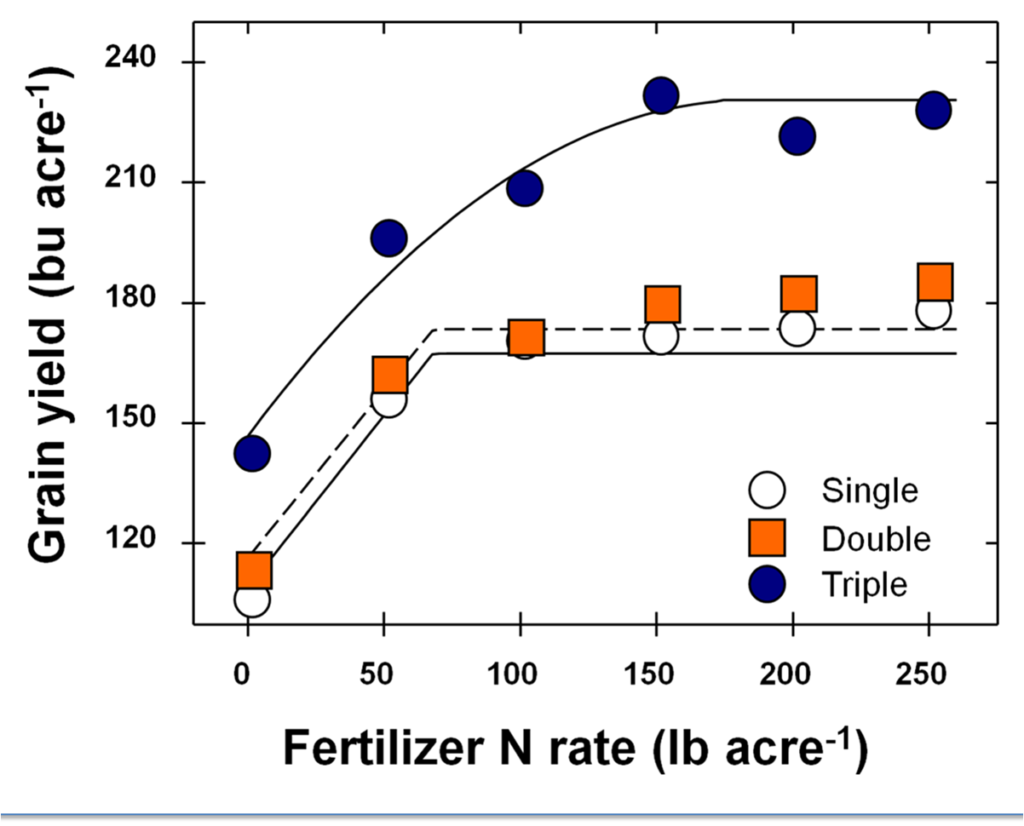
The hybrid factor of the Seven Wonders also encompasses biotechnology traits such as those for control of corn rootworm. Our data shows that corn rootworm traits have already benefited corn nitrogen use (Figure 2). In this example, protection from corn rootworm increased yield with no fertilizer applied as well as the response to fertilizer application.
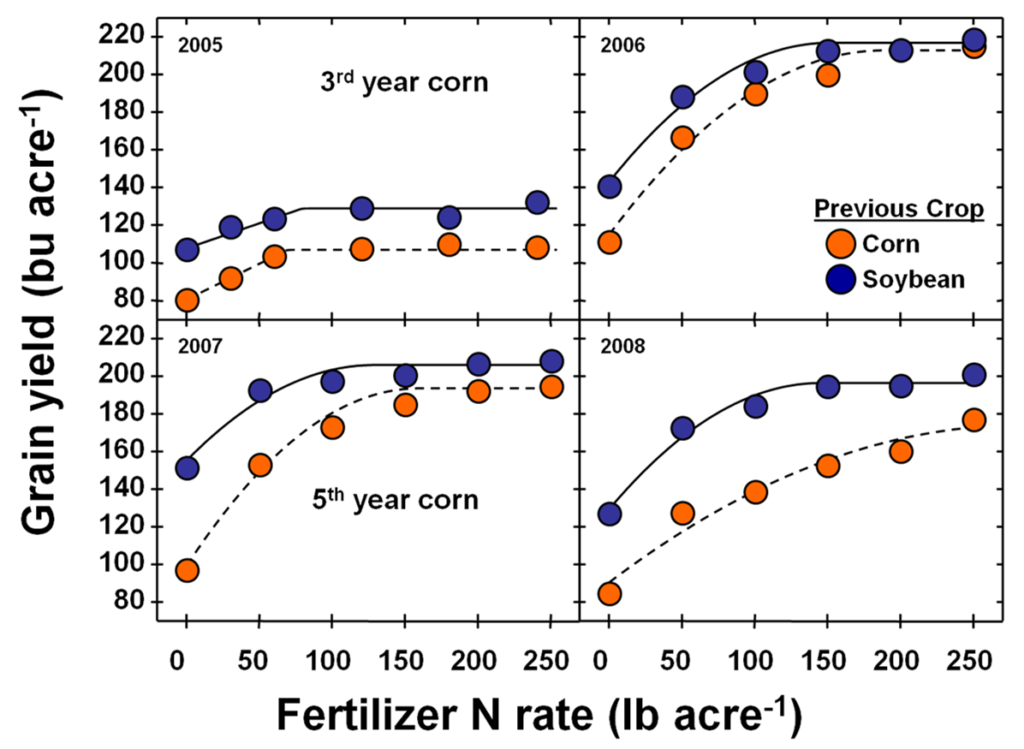
Previous crop (continuous corn versus corn following soybean) is the fourth wonder of the corn yield world. Accumulation of residue in continuous corn influences the availability of key nutrients like N and P. In the example shown in Figure 3, additional N was required to overcome the continuous corn yield penalty associated with 3rd year corn in 2006. In 2005 (3rd year corn) as well as both years of 5th year corn, no amount of extra N fertility could completely overcome the continuous corn yield penalty.
In addition to influencing nutrient availability, the accumulation of corn residue might also lead to a build-up of autotoxic compounds that reduce corn growth and yield. We are investigating the cause of the continuous corn yield penalty as well as corn stover removal as a management practice in our sustainability study.
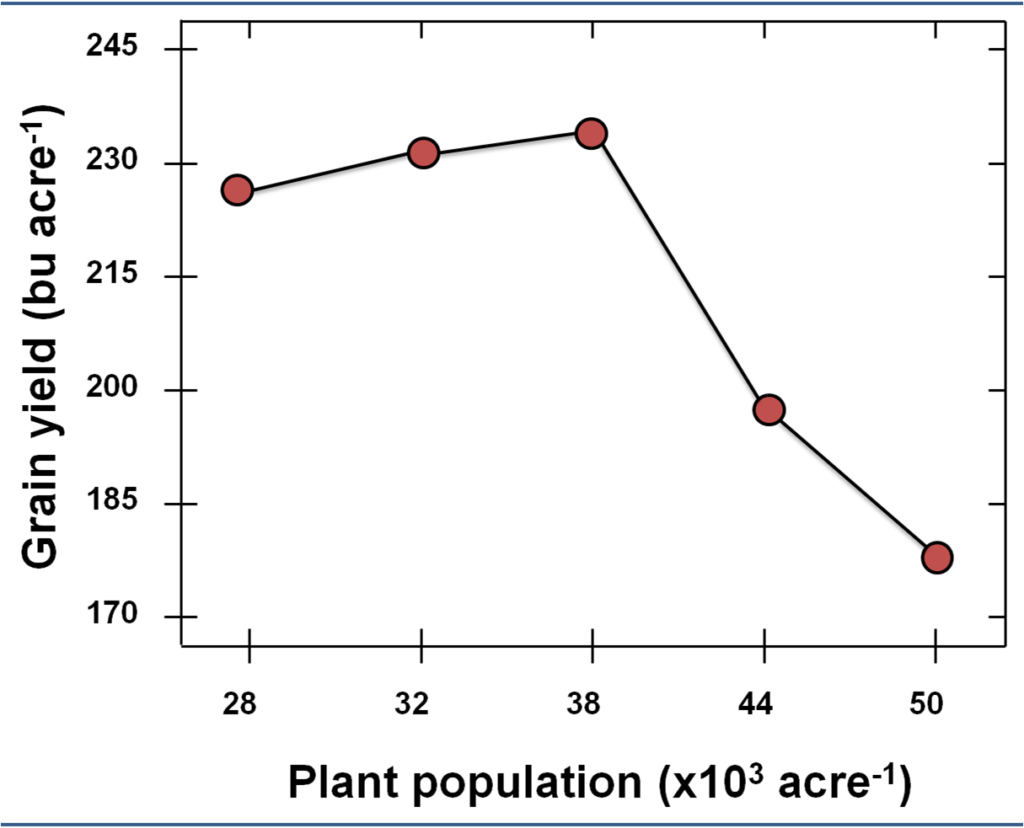
Plant population must increase as we strive to achieve higher yields. Increased plant population, however, results in increased inter-plant competition that must be managed. As an example, in 2009, plant populations beyond 38,000 plants/acre resulted in a linear decrease in grain yield (Figure 4). Response to plant population is heavily infuenced by the weather, nitrogen availability, and hybrid.
Not all hybrids are created alike in their ability to tolerate increased plant population. We are identifying ‘racehorse’ hybrids, or those can respond positively to extra N and population, using our Management Yield Potential trial. In 2011, this trial showed that current commercial hybrids ranged from a 25 bushel/acre decrease to a nearly 12 bushel/acre increase as plant population was increased from 32,000 to 45,000 plants/acre.
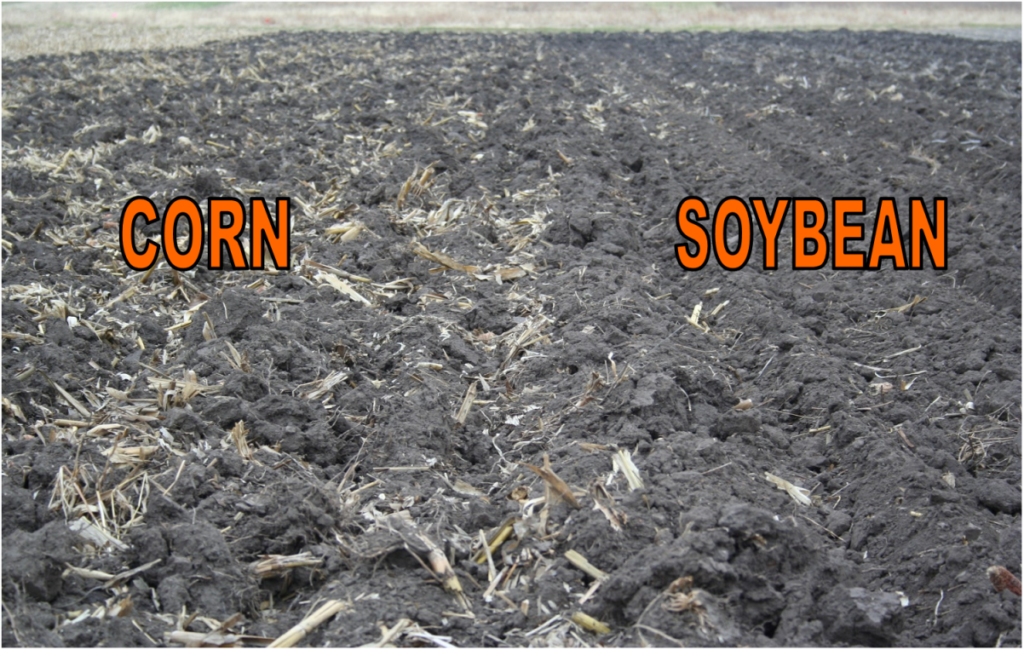
Tillage can vary widely in its mechanism, timing, and degree. There is no one-size-fits-all approach to tillage, and practices may vary according to geography and crop rotation. The effect of previous crop on soil tilth following a tillage activity can be stark (Figure 5). In this example, tillage was needed to bury the accumulated residue from continuous corn production; however, extra passes were required to prepare a suitable seedbed. In contrast, minimal tillage was required to prepare a light, even seedbed when soybean was the previous crop.
Strip-tillage is one approach that simultaneously allows for increased residue retention and nutrient placement. We are utilizing strip-tillage accompanied by P placement as a management practice in our sustainability study.
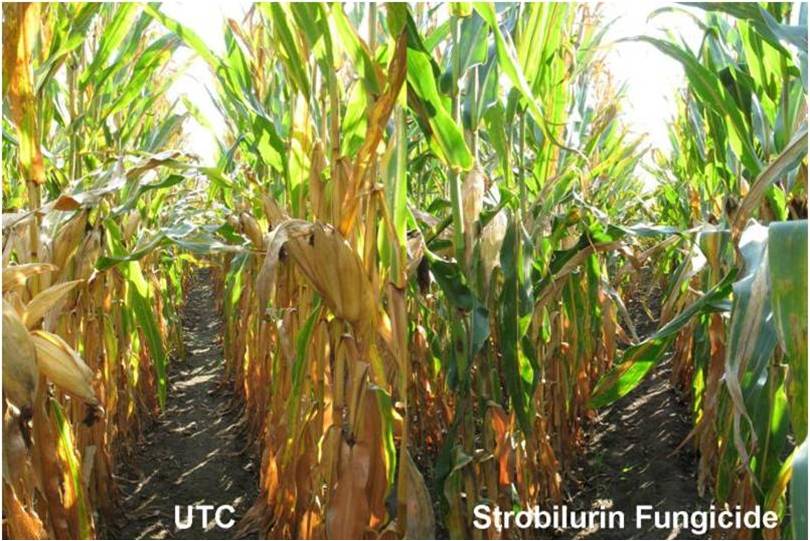
The seventh wonder of the corn yield world (Growth Regulators) encompasses a wide variety of products that can modulate corn growth and yield. These products include seed treatments, ethylene blockers (e.g., Invinsa), and strobilurin fungicides. The ‘greening’ or ‘plant health’ effect associated with application of strobilurin fungicides is a good example (Figure 6). We have documented this effect in the absence of yield-limiting disease, especially under intensive management systems where all other factors are optimized. Although it is difficult to experimentally separate physiological effects from disease control, we believe that strobilurin fungicides elicit a change in the ethylene-mediated senescence trajectory of source leaves.
One final comment…..
The Seven Wonders approach assumes a few key prerequisites. These prerequisites include drainage, pest/weed control, proper soil pH, and adequate levels of P and K based on soil tests. Crop production would not be possible in many parts of the midwest without tile drainage. Similarly, weeds and other pests do not add yield. A soil test that is low for P and K indicates that you should apply fertilizer, but our omission plot approach shows that a medium or high P soil test value may not be adequate for meeting the needs of a well-managed corn crop grown at a high population.
Nitrogen, hybrid, population, and strobilurin fungicides along with a better prerequisite (extra P fertility) are among the factors of the Corn Yield World that we are experimentally evaluating in our corn omission plot trials. These field trials allow us to assign a value to each of the factors under ‘traditional’ and ‘high-tech’ management systems. We have measured as much as a 50 bushel/acre increase in yield using a five-factor high-tech management system that includes extra P fertility (100 lb P2O5/acre), weather-protected N, a biotech insect-protected hybrid grown at 45,000 plants/acre, and a strobilurin fungicide applied at plant growth stage VT/R1.
Related documents and links
- Becker, R. 2012. Management of higher populations in maize. University of Illinois at Urbana-Champaign MS thesis. [link to abstract and PDF]
- Below, F.E., K.A. Duncan, M. Uribelarrea, and T.B. Ruyle. 2009. Occurrence and proposed cause of hollow husk in maize. Agron. J. 101:237-242. [open access article]
- Bergerou, J.A., L.E. Gentry, M.B. David, and F.E. Below. 2004. Role of N2 fixation in the soybean N credit in maize production. Plant and Soil 262:383-394. [external link to publisher]
- Gentry, L.E., F.E. Below, M.B. David, and J.A. Bergerou. 2001. Source of the soybean N credit in maize production. Plant and Soil 236:175-184. [external link to publisher]
- Gentry, L.F., M.L. Ruffo, and F.E. Below. Identifying factors controlling the continuous corn yield penalty. Agron. J., doi:10.2134/agronj2012.0246
- Gentry, L.F., M. Ruffo, and F.E. Below. 2012. The continuous corn yield penalty: understanding the agents and mechanisms. Meeting abstract from the Crop Science Society of America International Annual Meeting. October 2.1-24, 2012. Cincinnati, OH. [external link to meeting abstract]
- Haegele, J.W., and F.E. Below. 2009. Does the rootworm Bt trait improve N use and productivity of corn? Poster presented at the Crop Science Society of America International Annual Meeting. November 1-5, 2009. Pittsburgh, PA. [PDF, 115 KB]
- Haegele, J., A. Henninger, and F. Below. 2010. Characterization of nitrogen use strategies in commercial maize hybrids. Poster presented at the Crop Science Society of America International Annual Meeting. October 31 – November 4, 2010. Long Beach, CA. [external link to meeting abstract] [PDF, 161 KB]